Category:
Market AnalysisBNB Price Breaks $600: Bulls Eye $635 Rally 📈

Binance Coin (BNB) has successfully reclaimed the critical $600 psychological level, marking a significant milestone in its ongoing recovery throughout 2026. Trading near $605 on August 10th, the world's largest cryptocurrency exchange token is now positioning itself for a potential advance toward $635 and beyond. With improving technical momentum and substantial liquidation clusters positioned strategically above current prices, market participants are closely monitoring whether bulls can sustain this breakout or if sellers will reassert control. 🚀
BNB's Journey Back to $600: A Technical Milestone
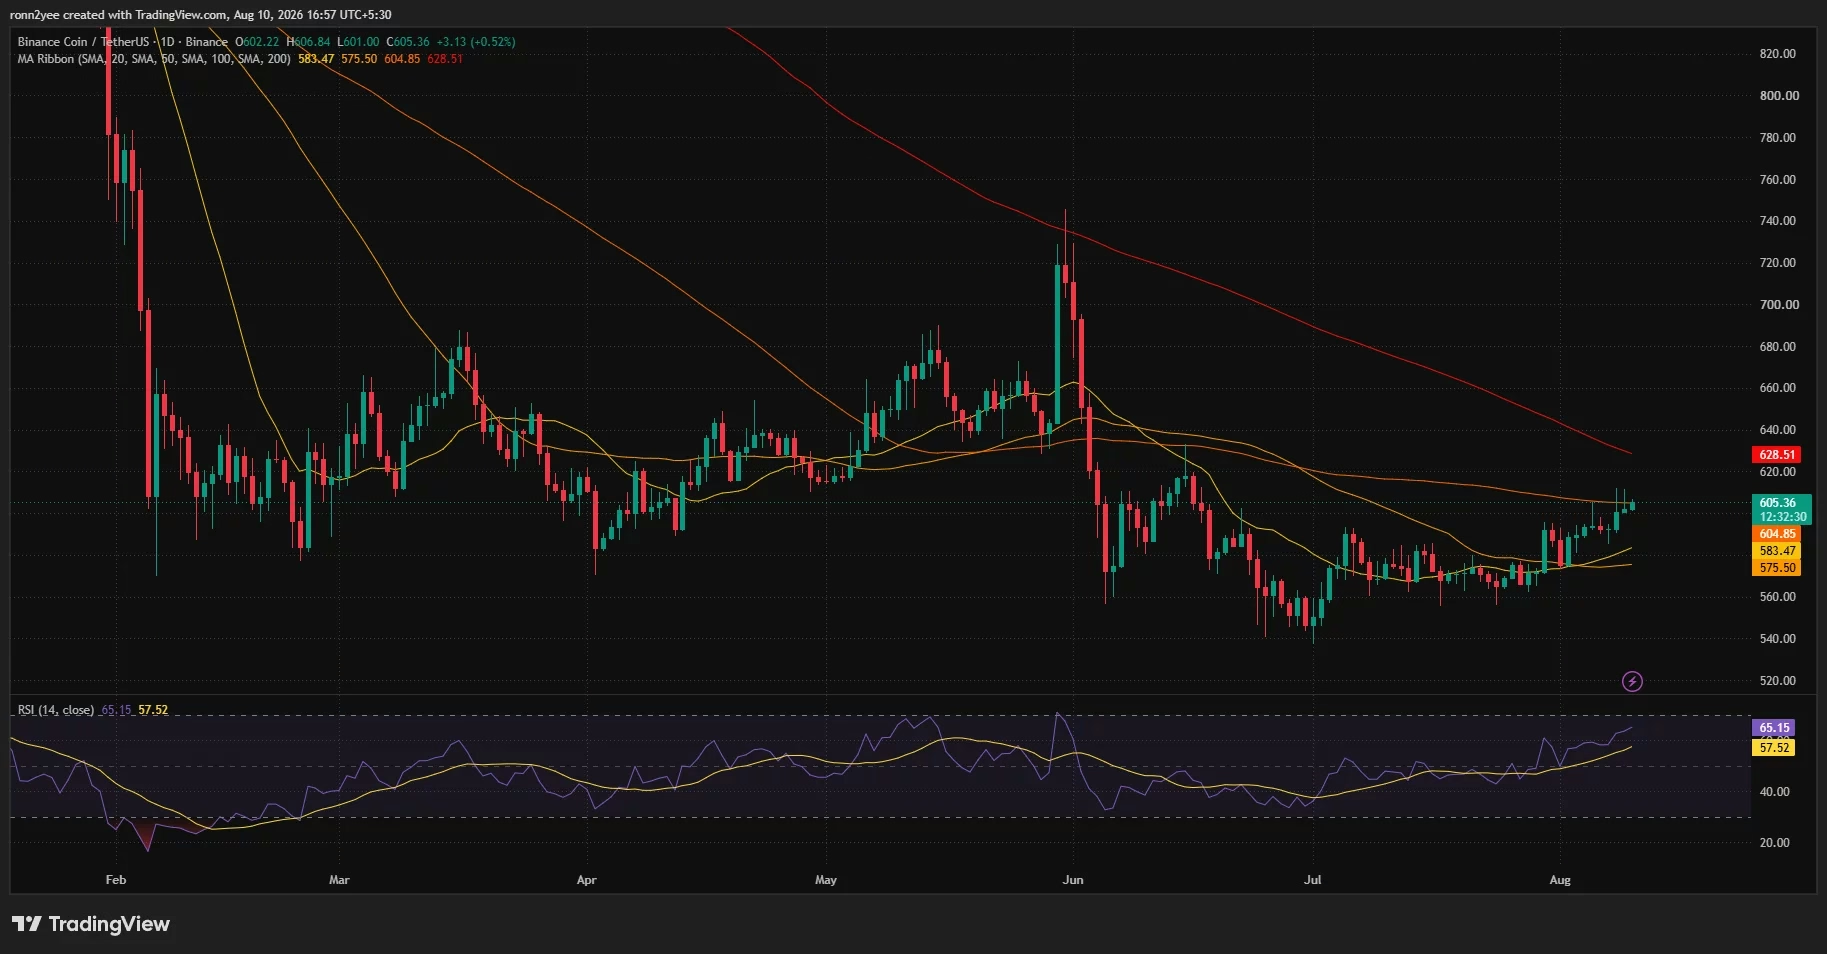
The path to reclaiming $600 has been methodical and deliberate. BNB recovered from a challenging June low near $540, with buying interest gradually accumulating throughout July before accelerating during the first ten days of August. This recovery represents approximately a 12% gain from the June bottom, demonstrating resilience amid broader cryptocurrency market volatility.
What makes this recovery particularly noteworthy is how BNB has systematically reclaimed its key moving averages. The token has successfully positioned itself above both its 20-day moving average (near $583.47) and 50-day moving average (near $575.50), establishing what technical analysts call a "higher-high structure." This pattern typically suggests strengthening upward momentum, though the story becomes more nuanced when examining the full technical picture. 📊
Momentum Indicators Paint an Optimistic Picture
The daily Relative Strength Index (RSI) has climbed to 65.15, positioning itself above its signal average of 57.52. This reading is particularly significant because it demonstrates strengthening buyer demand without entering overbought territory (which typically occurs above 70). The RSI's position suggests there remains room for additional upside before momentum becomes unsustainably stretched.
However, the technical setup reveals some important nuances:
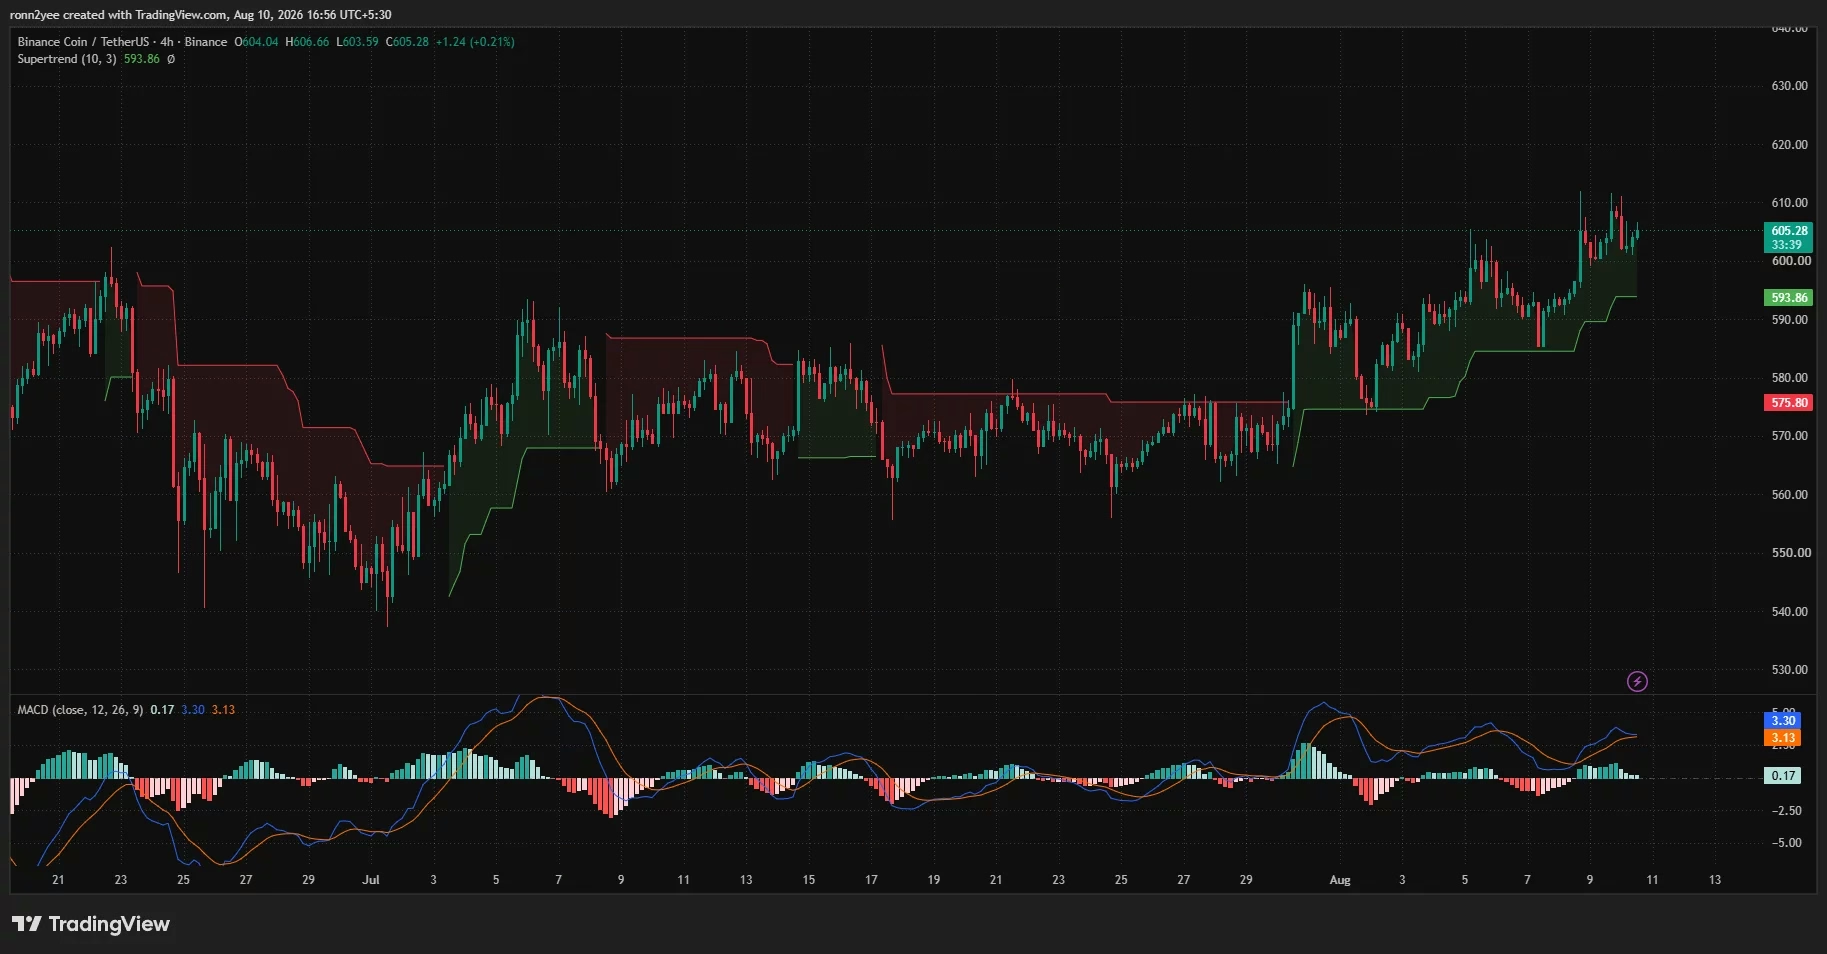
- MACD Momentum: The Moving Average Convergence Divergence indicator remains positive, with the MACD line at 3.30 and signal line at 3.13, but the histogram has narrowed to just 0.17
- Momentum Divergence: This narrowing histogram indicates that upward momentum is gradually slowing as BNB tests resistance levels
- Volume Concerns: Trading volume has not increased proportionally with the price recovery, creating a potential vulnerability
This divergence between price action and volume participation is a critical consideration for traders assessing the sustainability of the current rally. A price advance without corresponding volume increases often struggles to break through multiple resistance levels. 💭
The 100-Day Moving Average: A Crucial Inflection Point
BNB is currently testing its 100-day moving average positioned near $604.85—essentially where the token is trading. A sustained daily close above this level would represent a meaningful shift in the technical setup and would redirect attention toward the 200-day moving average at $628.51.
The significance of the 100-day moving average cannot be overstated. This intermediate-term indicator has historically served as a barometer for whether an asset is in a medium-term uptrend or downtrend. Breaking decisively above it would suggest that BNB has shifted from recovery mode into genuine trend establishment.
On the 4-hour timeframe, the Supertrend indicator has risen to $593.86 and remains bullish after flipping in late July. This technical tool, which identifies trend changes through volatility-adjusted support and resistance levels, continues to track price action higher. As long as BNB remains above $593.86, the short-term technical bias remains constructively bullish. ✨
Resistance Levels: The Path to $635
The immediate resistance zone spans $606–$610, representing recent intraday highs where sellers have repeatedly demonstrated their presence. Breaking through this zone with conviction would be the first requirement for a meaningful rally.
Beyond the immediate resistance, a more significant opportunity emerges. Liquidation analysis reveals concentrated short positions (bearish bets) clustered around $618–$623. This concentration is crucial because if BNB breaks through $610 with increasing volume, forced closures of these short positions could create a cascading effect—what traders call a "short squeeze." Such an event can accelerate price advances as short sellers rush to cover losing positions.
The $628–$635 region represents the broader target zone that bulls are eyeing. The 200-day moving average at $628.51 sits within this range, making it a natural resistance level. Additional liquidity pools appear near $630 and $635, creating a dense supply zone that would require sustained buying pressure to overcome. 🎯
Liquidation Heatmap: Understanding Market Positioning
Examining the 3-day liquidation heatmap reveals the current positioning of leveraged traders. The most significant concentration of short exposure exists around $622–$623, with secondary clusters at $618–$620. These liquidation levels are not mere coincidence—they represent price points where margin traders have placed their stop-losses and where exchanges would automatically close underwater positions.
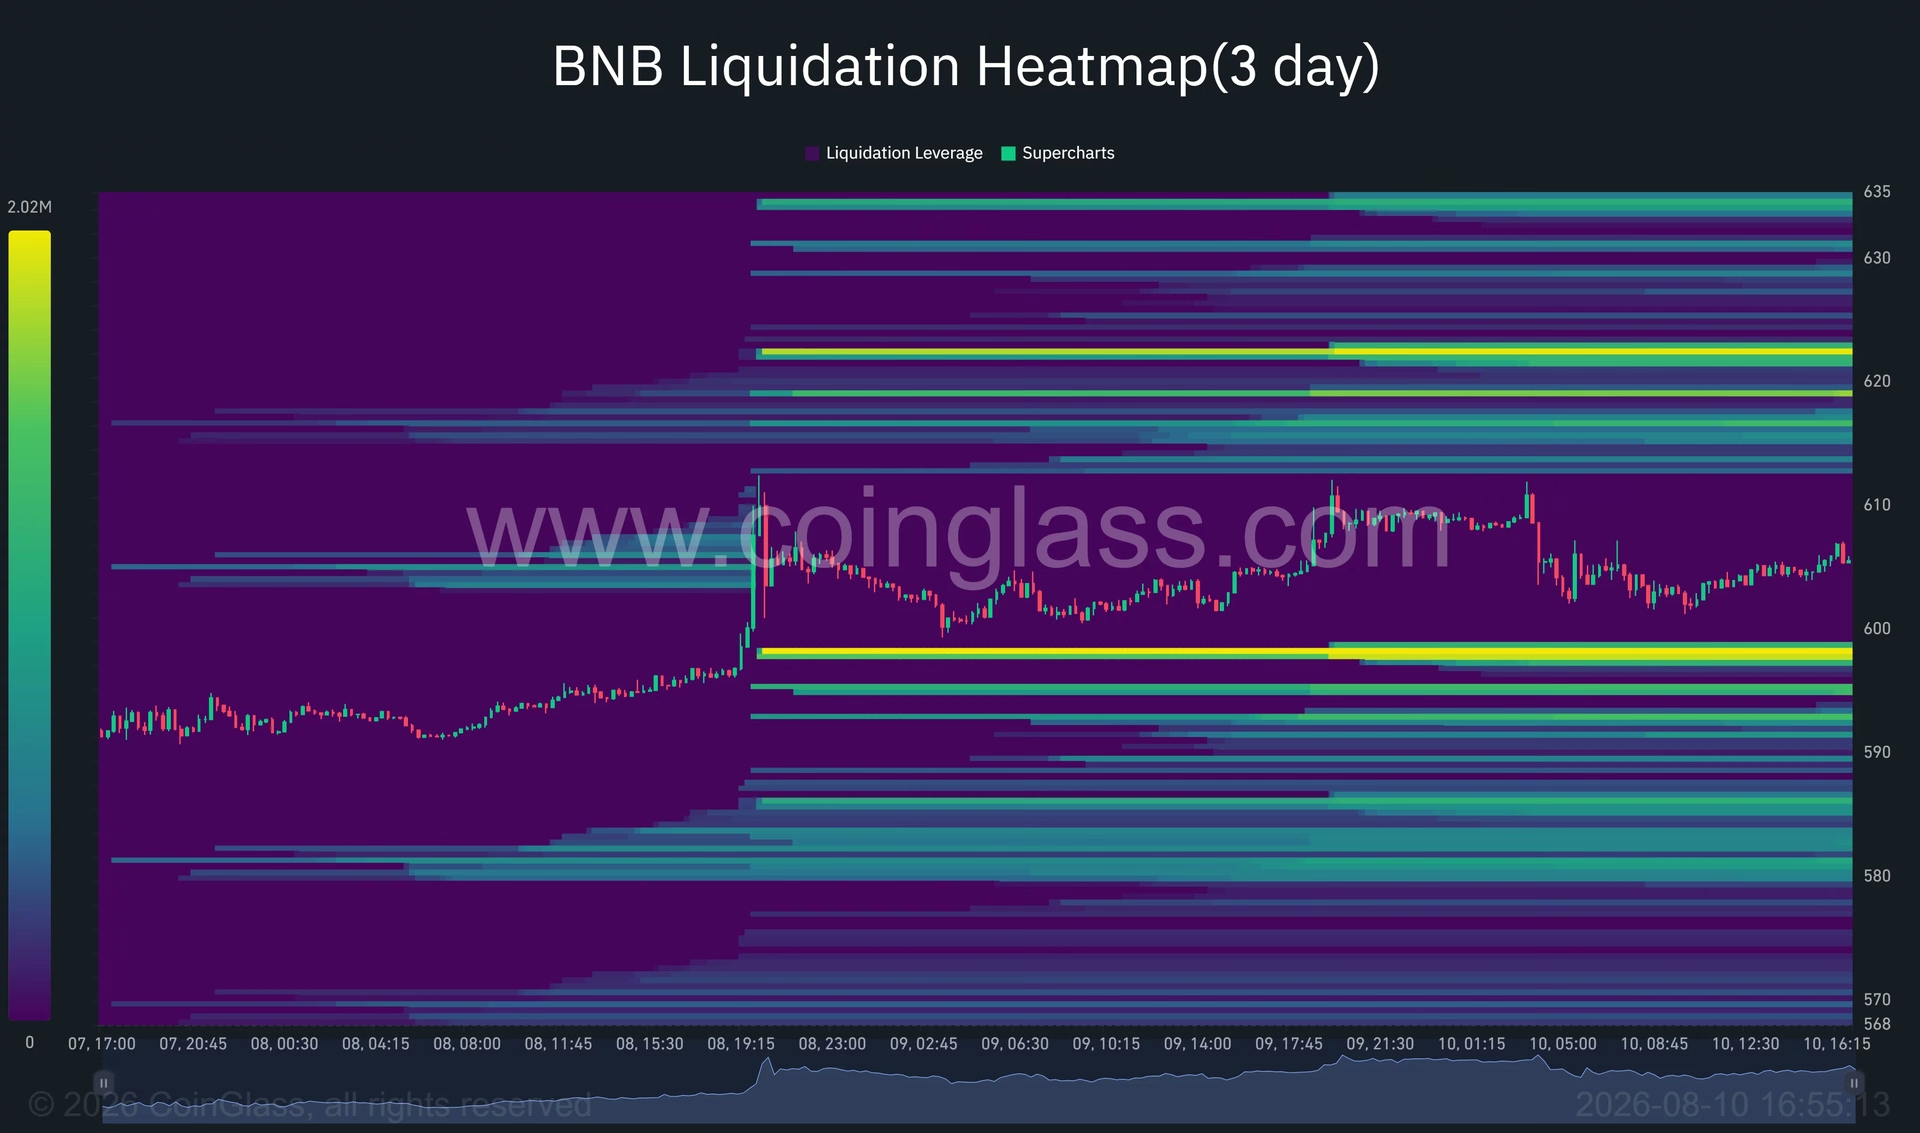
On the downside, the closest liquidity pool sits around $598—just below the psychological $600 mark. This level could attract price during any short-term correction or profit-taking. The Supertrend support at $593.86 provides the next meaningful floor, with deeper support found at the 20-day moving average ($583.47) and ultimately the 50-day moving average ($575.50).
Understanding these liquidation clusters is essential because they represent genuine market structure. When BNB approaches these levels with increasing volume, the forced liquidations can create self-reinforcing price movements—either accelerating rallies or exacerbating declines. 📍
The Longer-Term Perspective: $780–$790 on the Radar
While short-term traders focus on the $635 target, some analysts are mapping a more ambitious longer-term scenario. Crypto commentator DongPham has identified $780–$790 as a possible retest area for BNB, contingent on specific technical conditions being met.
According to this analysis, reaching the $780–$790 zone would require BNB to accomplish several milestones:
- Successfully reclaim and sustain the $628–$635 resistance zone
- Break above the former long-term trend level near $673 (lost in February)
- Establish a new higher-high structure above current recovery highs
However, DongPham has also flagged a critical concern: trading volume has not increased alongside the latest recovery. This divergence between price strength and volume participation suggests that the longer-term $780–$790 projection remains a medium to longer-term scenario rather than an immediate target. The path to such levels would require genuine accumulation and sustained institutional interest. 🔮
Risk Factors: What Could Derail the Rally
While the immediate setup appears constructive, several risk factors could invalidate the bullish scenario:
Technical Invalidation: A confirmed break below $594 would signal that the current breakout attempt has failed. This would expose the 20-day moving average at $583.47 and potentially trigger a retest of the June lows near $540.
Macro Headwinds: BNB remains sensitive to broader cryptocurrency movements and global risk sentiment. Changes in Bitcoin and Ethereum prices, fluctuations in US interest rates, Treasury yields, and dollar strength can all impact demand for higher-risk assets like altcoins.
Ecosystem-Specific Risks: As Binance's native token, BNB carries unique risks related to regulatory developments affecting the Binance ecosystem. Changes in exchange operations, compliance challenges, or shifts in trading volumes on Binance can directly impact BNB's price action.
Liquidity Variations: US traders may experience different liquidity conditions compared to global traders. Availability and spreads on American trading platforms can differ significantly from international exchanges, potentially affecting execution quality during volatile moves. ⚠️
What Traders Should Monitor Going Forward
The next critical level to watch is the $610 resistance. A confirmed 4-hour close above this level would signal renewed strength and likely trigger a move toward the $618–$623 liquidation cluster. Conversely, rejection at $610 would suggest that selling pressure remains formidable.
Volume participation is equally important. Watch whether trading volume increases as BNB approaches resistance levels. Breakouts accompanied by increasing volume are far more likely to sustain, while volume divergence suggests caution.
The broader cryptocurrency market environment cannot be ignored. Bitcoin's movements, Ethereum's price action, and general risk sentiment in global markets all influence BNB's trajectory. A risk-off environment could pressure BNB even if its technical setup remains constructive. 🔍
The Bottom Line: Cautious Optimism
BNB's break above $600 represents a genuine technical achievement that opens the door to further upside toward $635 and potentially higher. The combination of improving momentum indicators, reclaimed moving averages, and strategically positioned liquidation clusters above current prices creates an asymmetric risk-reward setup favoring bulls—at least in the near term.
However, the lack of proportional volume increases and the presence of multiple resistance levels between $605 and $635 suggest that reaching these targets will require sustained buying pressure and broader market support. The $628–$635 zone represents a genuine challenge that bulls must overcome to validate the longer-term bullish narrative.
For traders, the key is maintaining discipline around the defined support levels. As long as BNB holds above $593.86, the technical bias remains constructive. Breaking below this level would require a reassessment of the bullish thesis. Meanwhile, a sustained close above $610 would significantly increase the probability of a move toward the $618–$623 liquidation cluster.
The story of BNB's recovery is still being written, but the current technical setup suggests bulls have genuine reason for optimism—provided they can maintain momentum through the resistance gauntlet ahead. 🌟
You May Also Like

Market Analysis
XRP Price Falls 5% as Leverage Hits Seven-Month High
August 26, 2026

Market Analysis
Crypto Market Hits Extreme Greed: What This Means for Bitcoin
August 26, 2026

Market Analysis
Ethereum Price Rally Overheats Below $2,550 Resistance
August 26, 2026

Market Analysis
Hyperliquid Price Rally: HYPE Targets $97 Amid $80 Support
August 25, 2026