Category:
Market AnalysisBNB Price Eyes $734 After Reclaiming $700 Support

BNB Surges Past $700 Milestone 🚀
Binance Coin (BNB) has demonstrated remarkable momentum in recent trading sessions, with the token commanding attention as it reclaims key support levels and positions itself for potential breakout territory. Trading near $704 on August 24, BNB showcased an impressive 16% gain over seven days, reflecting sustained buying pressure and renewed investor confidence in the broader cryptocurrency ecosystem.
The token's journey back above the psychological $700 barrier represents more than just a technical milestone—it signals that institutional and retail buyers alike remain committed to pushing the asset higher despite recent volatility. This reclamation of support comes at a particularly interesting juncture, with multiple catalysts converging to support upward price action.
The Rally That Broke Through Resistance 📈
BNB's advance wasn't a sudden spike but rather a methodical breakout from a restrictive trading range. Throughout the first half of August, the token had been confined between $600 and $620, creating frustration among traders awaiting directional clarity. When buyers finally mustered the strength to breach this range around August 20, momentum accelerated dramatically.
The path unfolded as follows: after breaking free from the $600–$620 consolidation, BNB rapidly pushed through the $650 level before making an aggressive run toward $720 over the weekend. The token briefly touched $725 before profit-taking emerged, pulling the price back below $690 in a natural correction.
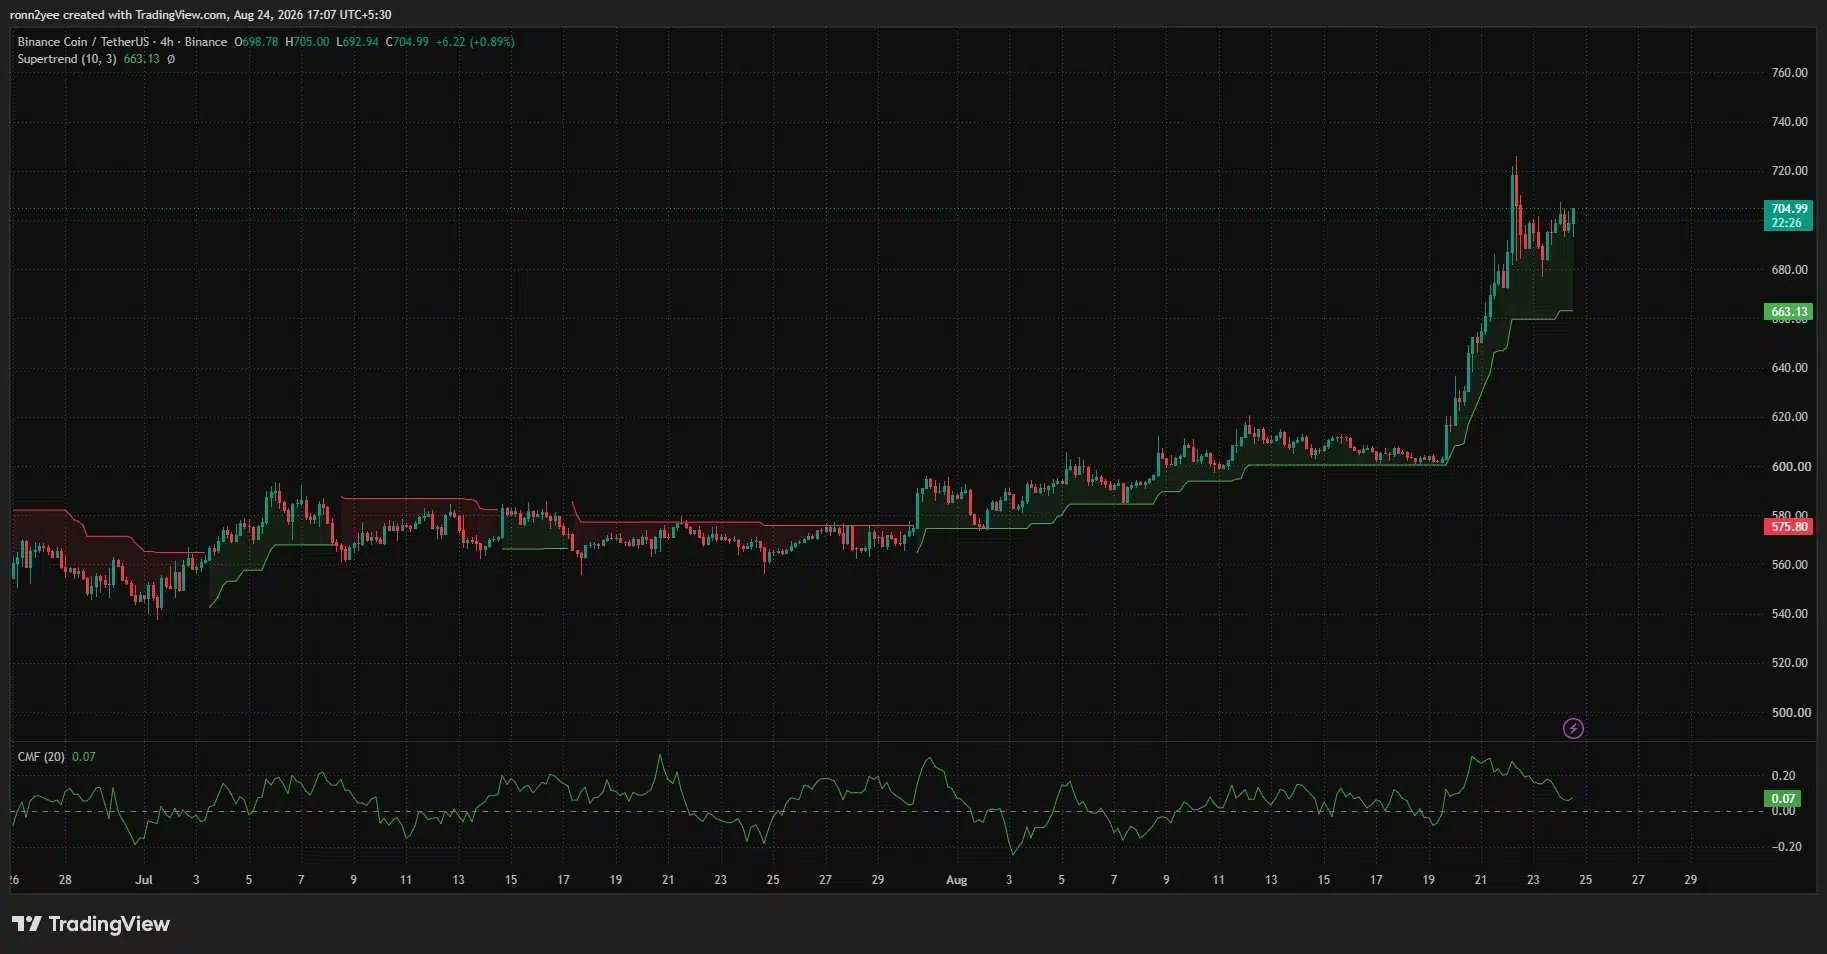
What's particularly bullish about this pullback is how buyers stepped in to defend the $700 level. On the 4-hour timeframe, BNB formed a series of higher lows, indicating that sellers lacked the conviction to push significantly lower. The 4-hour chart revealed that the latest candle traded between $692.94 and $705, demonstrating clear buying interest at dips.
Technical Indicators Flash Mixed Signals ⚡
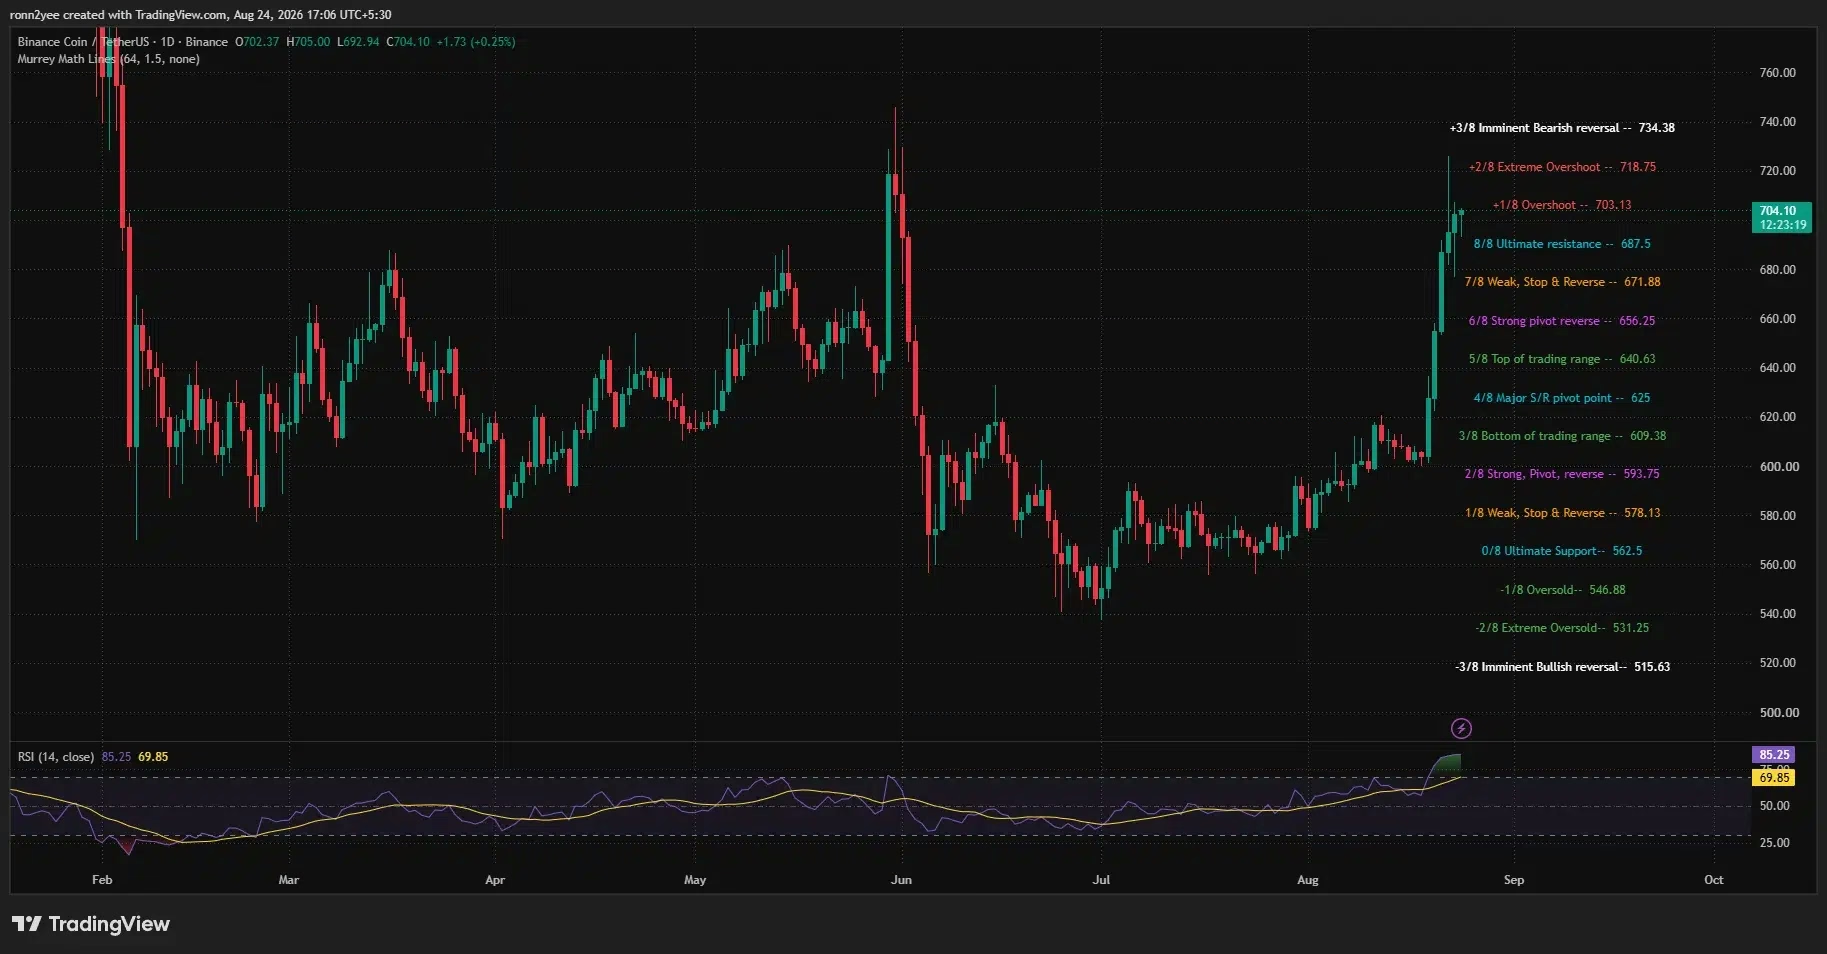
While the price action remains constructive, the technical indicators present a nuanced picture that traders should carefully monitor. The daily Relative Strength Index (RSI) has climbed to 85.25—well above the conventional overbought threshold of 70. This elevated reading suggests that momentum has been extraordinarily strong, but it also raises the possibility of consolidation or a sharper pullback if buying pressure diminishes.
Interestingly, the RSI's moving average sits at 69.85, which demonstrates just how rapidly momentum accelerated during the recent breakout. This divergence between current RSI levels and its moving average is a telltale sign of explosive buying that may not be sustainable indefinitely.
On the positive side, the 4-hour Supertrend indicator remains firmly bullish, with dynamic support established at $663.13. The Chaikin Money Flow on the 4-hour chart registered at 0.07, a positive reading that confirms more capital is flowing into BNB than leaving it—though the indicator has moderated from the elevated levels seen during the initial breakout phase.
Resistance Levels to Watch: $719 and $734 🎯
If BNB continues its upward trajectory, traders should monitor several critical resistance zones. The $719 area represents the first major test, as it sits near the recent local high and coincides with an elevated band of short-liquidation exposure. A daily close above this level could reignite momentum toward a retest of $725, ultimately targeting the $734–$745 region.
The $734.38 level holds particular significance as it aligns with Murray Math resistance calculations and represents the next substantial technical barrier. Breaking above $719 with conviction would likely trigger additional short-covering, potentially accelerating the move toward these higher targets.
On the downside, support remains well-defined at multiple levels:
- $703: The immediate support zone
- $687.50: Former resistance that's now acting as support
- $663.13: The 4-hour Supertrend level
- $656–$640: Extended support region if momentum reverses
Liquidation Heatmap Reveals Price Magnets 🧲
The 24-hour CoinGlass liquidation heatmap provides valuable insight into where price action might accelerate or consolidate. The closest major concentration of leveraged positions clusters around $709–$711, representing the immediate zone BNB was approaching during the analysis period.
This concentration is particularly important because a break above $710 could trigger cascading short-position closures, creating additional buying pressure that propels the token toward higher levels. The liquidation data shows further significant clusters between $714 and $720, then again near $724, $730, and $734.
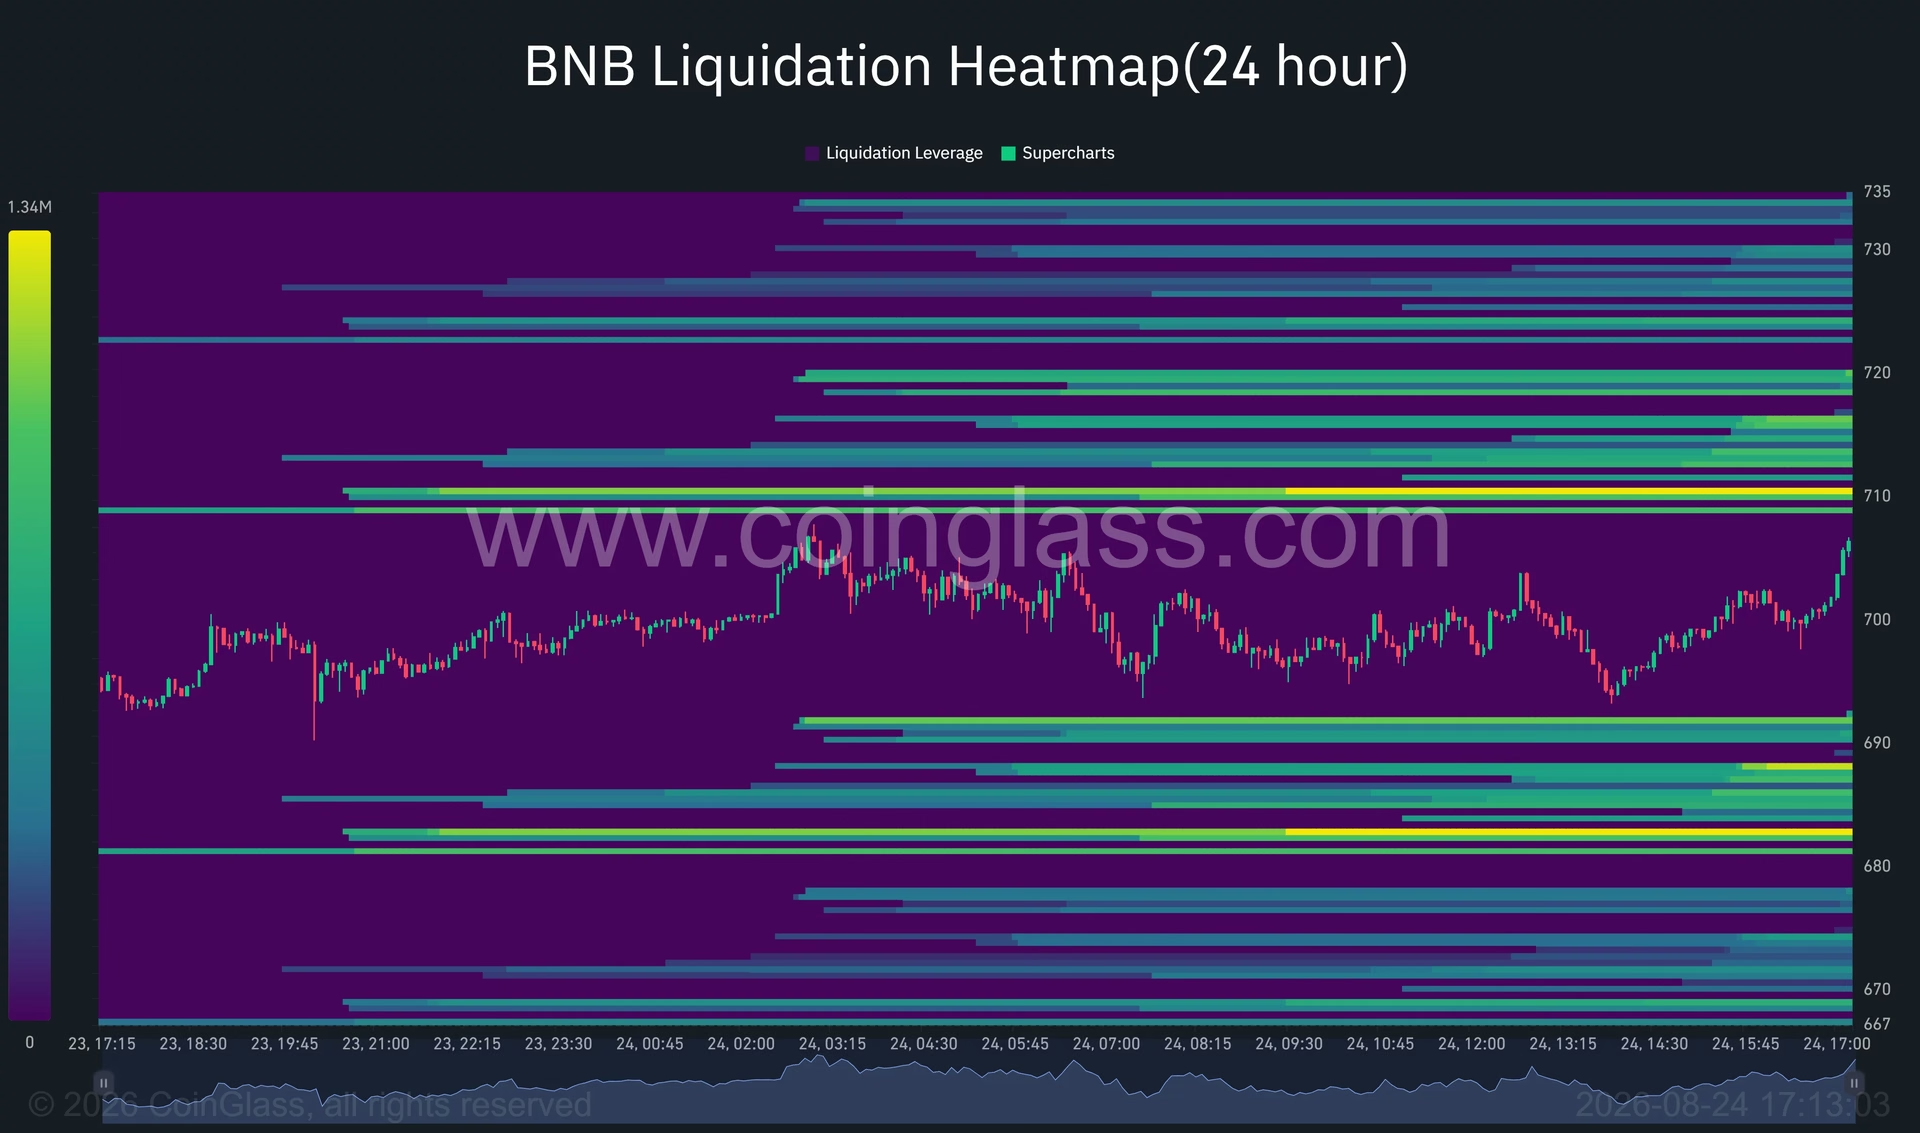
On the downside, notable liquidity pools exist around $691, $687, and $682, suggesting that sharp declines could find support at these levels before triggering further selling pressure.
The Pasteur Hard Fork Catalyst 🔧
Beyond technical factors, a significant network event is adding fundamental support to BNB's rally. The Pasteur hard fork was scheduled to activate on BNB Smart Chain on August 25 at 2:30 a.m. UTC, requiring node operators to upgrade to client version v1.7.7.
This upgrade combines three important proposals designed to enhance the network's capabilities:
- Cross-chain transfer security improvements - Strengthening the security framework for assets moving between blockchains
- Validator key permission restrictions - Limiting permissions associated with replaced validator keys
- Block capacity increases - Expanding network throughput to handle more transactions
Internal testing demonstrated that the Pasteur upgrade would increase transaction throughput from 1,237 to 2,324 transactions per second—an 88% improvement that addresses scalability concerns. While the upgrade doesn't directly alter BNB's token supply, it provides traders with a network-specific event to monitor while broader market demand for major cryptocurrencies remains robust.
Real-World Assets Explosion on BNB Chain 🌐
Beyond the hard fork, BNB Chain has witnessed an extraordinary expansion in tokenized real-world assets (RWAs). The network now hosts more than 1.15 million RWA holders—a staggering 580% increase over just 30 days.
This explosive growth in RWA adoption reflects broader industry trends toward bringing traditional financial assets onto blockchain networks. The network currently holds approximately $5.8 billion in distributed asset value, with 30-day RWA transfer volume reaching $28.17 billion. These figures underscore BNB Chain's growing importance in the Web3 ecosystem and its utility beyond simple token transfers.
Macro Tailwinds Supporting Risk Assets 💨
BNB's advance occurred within a favorable macro environment that lifted the entire cryptocurrency market. Bitcoin surged above $77,000, and numerous large-cap altcoins broke through long-standing resistance levels, creating a rising tide that lifted multiple boats.
Two significant developments contributed to this supportive backdrop:
SEC Regulatory Framework: On August 18, the Securities and Exchange Commission proposed Regulation Crypto Assets, a tailored securities offering framework specifically designed for certain investment contracts involving crypto assets. While this proposal doesn't classify BNB or grant it regulatory approval, it signals that the SEC is considering defined fundraising and disclosure pathways rather than applying the existing securities registration system without crypto-specific exemptions. This represents a meaningful shift toward regulatory clarity.
Treasury Bond Buyback Program: The U.S. Treasury Department doubled the planned size of long-term bond buybacks from a maximum of $2 billion to at least $4 billion per operation. While this program targets liquidity improvements in older long-dated Treasury securities, the resulting falling yields and weaker dollar created a more favorable backdrop for Bitcoin and other risk-sensitive assets.
Key Takeaways and What's Next 🔮
BNB's recovery above $700 and march toward $734 represents a compelling technical setup supported by both network fundamentals and macro conditions. However, traders should remain cognizant of the overbought RSI readings and the possibility of consolidation before additional breakouts occur.
The immediate focus should remain on whether BNB can decisively break above $719 with conviction. Success at this level would likely trigger short-covering and open the path toward $734–$745. Conversely, if momentum fades and the RSI mean-reverts, support at $703 and $687.50 would likely attract buyers.
With the Pasteur hard fork activating, RWA adoption accelerating, and macro conditions improving, BNB Chain's ecosystem continues strengthening fundamentally. The combination of technical strength, network catalysts, and favorable market conditions creates an intriguing setup for BNB price action in the coming weeks. 🌟
You May Also Like

Market Analysis
XRP Price Falls 5% as Leverage Hits Seven-Month High
August 26, 2026

Market Analysis
Crypto Market Hits Extreme Greed: What This Means for Bitcoin
August 26, 2026

Market Analysis
Ethereum Price Rally Overheats Below $2,550 Resistance
August 26, 2026

Market Analysis
Hyperliquid Price Rally: HYPE Targets $97 Amid $80 Support
August 25, 2026