Category:
Market AnalysisBNB Price Jumps 5% but Stalls Below $600

The Rally That Nearly Made It 🚀
Binance Coin (BNB) has captured trader attention with a decisive 5% surge, breaking through a resistance barrier that had constrained the token for approximately 45 days. However, the cryptocurrency's inability to definitively clear the $600 psychological level has left the market questioning whether this breakout will hold or fizzle like previous attempts.
On July 31, BNB climbed from the $570 region to reach an intraday high near $595 before settling around $590. This move represents more than just another price bounce—it signals a potential shift in market dynamics after weeks of consolidation that tested investor patience.
Breaking Free From Downtrend Pressure 📊
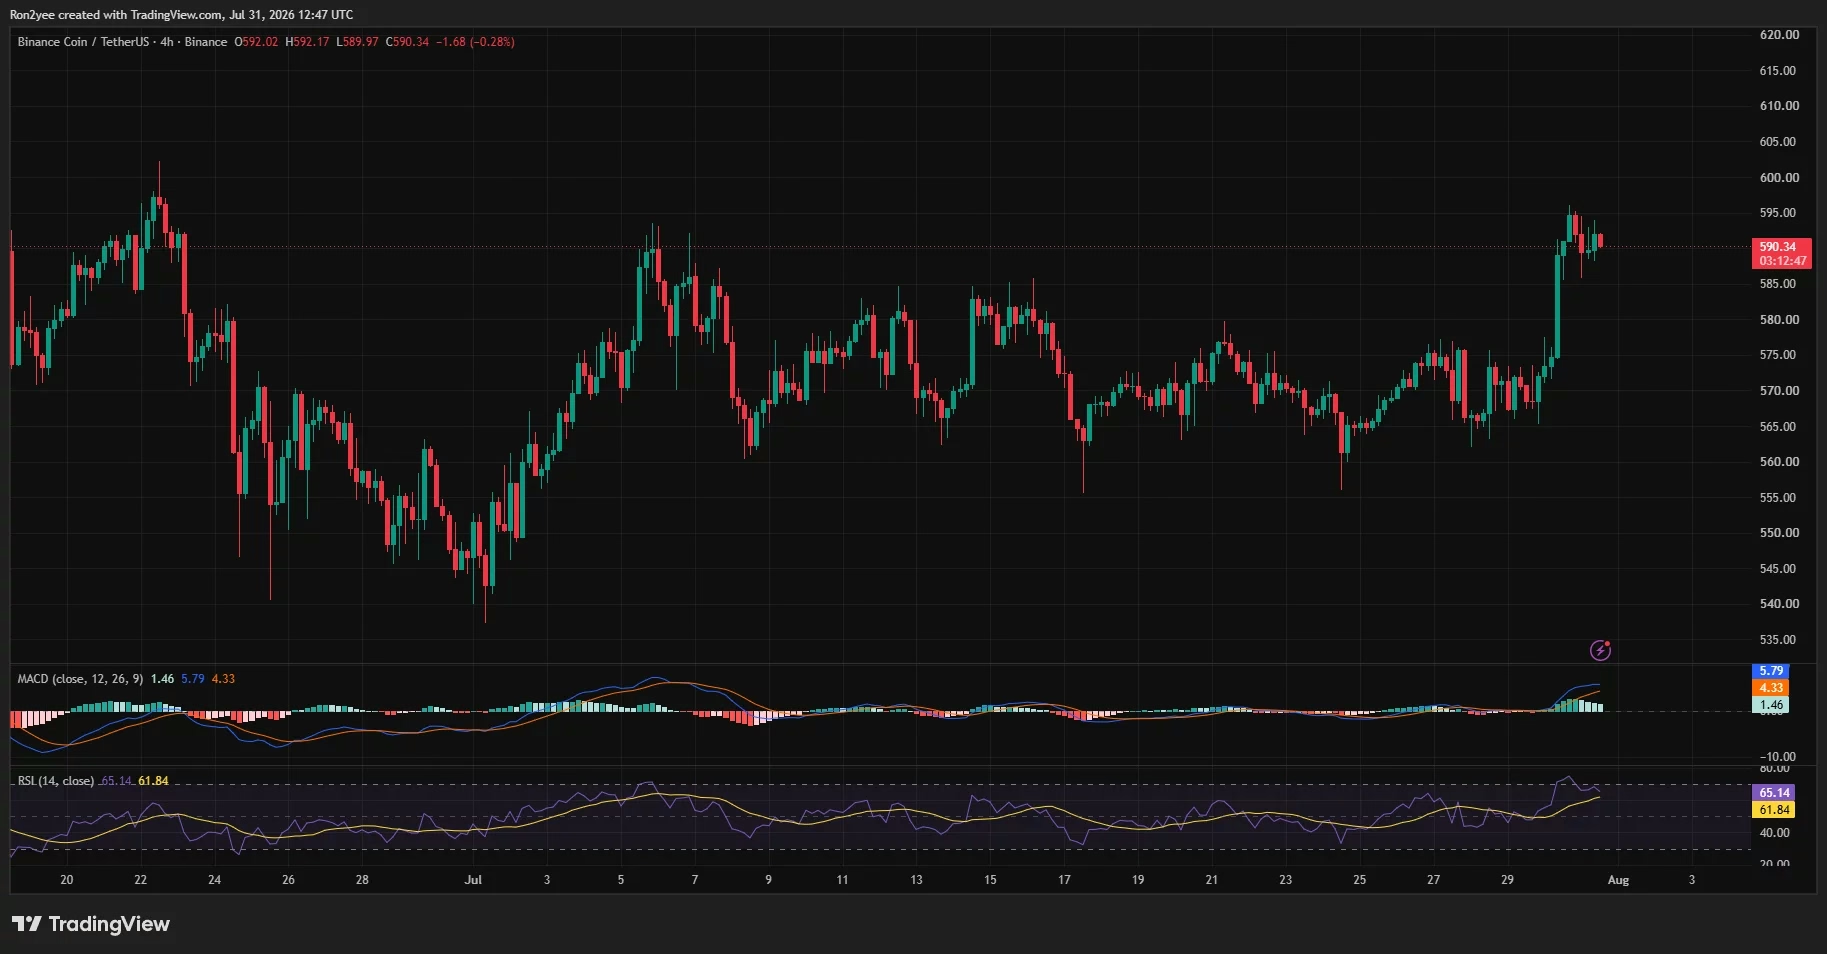
The technical backdrop for this rally is compelling. BNB successfully penetrated a descending trendline that had connected lower highs since the token traded near $632 in mid-June. This wasn't a minor technical achievement—it represented the first meaningful breach of a structural barrier that had confined price action for the better part of two months.
What makes this breakout different from previous failed attempts is the foundation beneath it. Earlier tests of resistance around $594-$598 occurred without the same degree of accumulation at lower levels. This time, BNB established a series of higher lows in the $560-$570 zone, creating a more robust platform for an extended move.
The daily chart revealed the strength of this advance through a sharp breakout candle above $575, followed by extension toward $595. Traders have since defended the $586-$590 region, though multiple upper wicks near $595 demonstrate that seller pressure remains formidable below the $600 mark.
Technical Indicators Send Mixed Signals ⚡
The momentum picture presents an interesting paradox. On the 4-hour timeframe, the relative strength index (RSI) stands at 65.14, positioned above its moving average of 61.84 but still comfortably below the overbought threshold of 70. This configuration suggests room for additional upside while warning that buyers are approaching stretched territory.
The moving average convergence divergence (MACD) continues to favor bulls, with the MACD line at 5.79 trading above the signal line at 4.33. However, the shrinking histogram bars suggest that the initial momentum burst is beginning to cool—a warning sign that the rally may be losing steam.
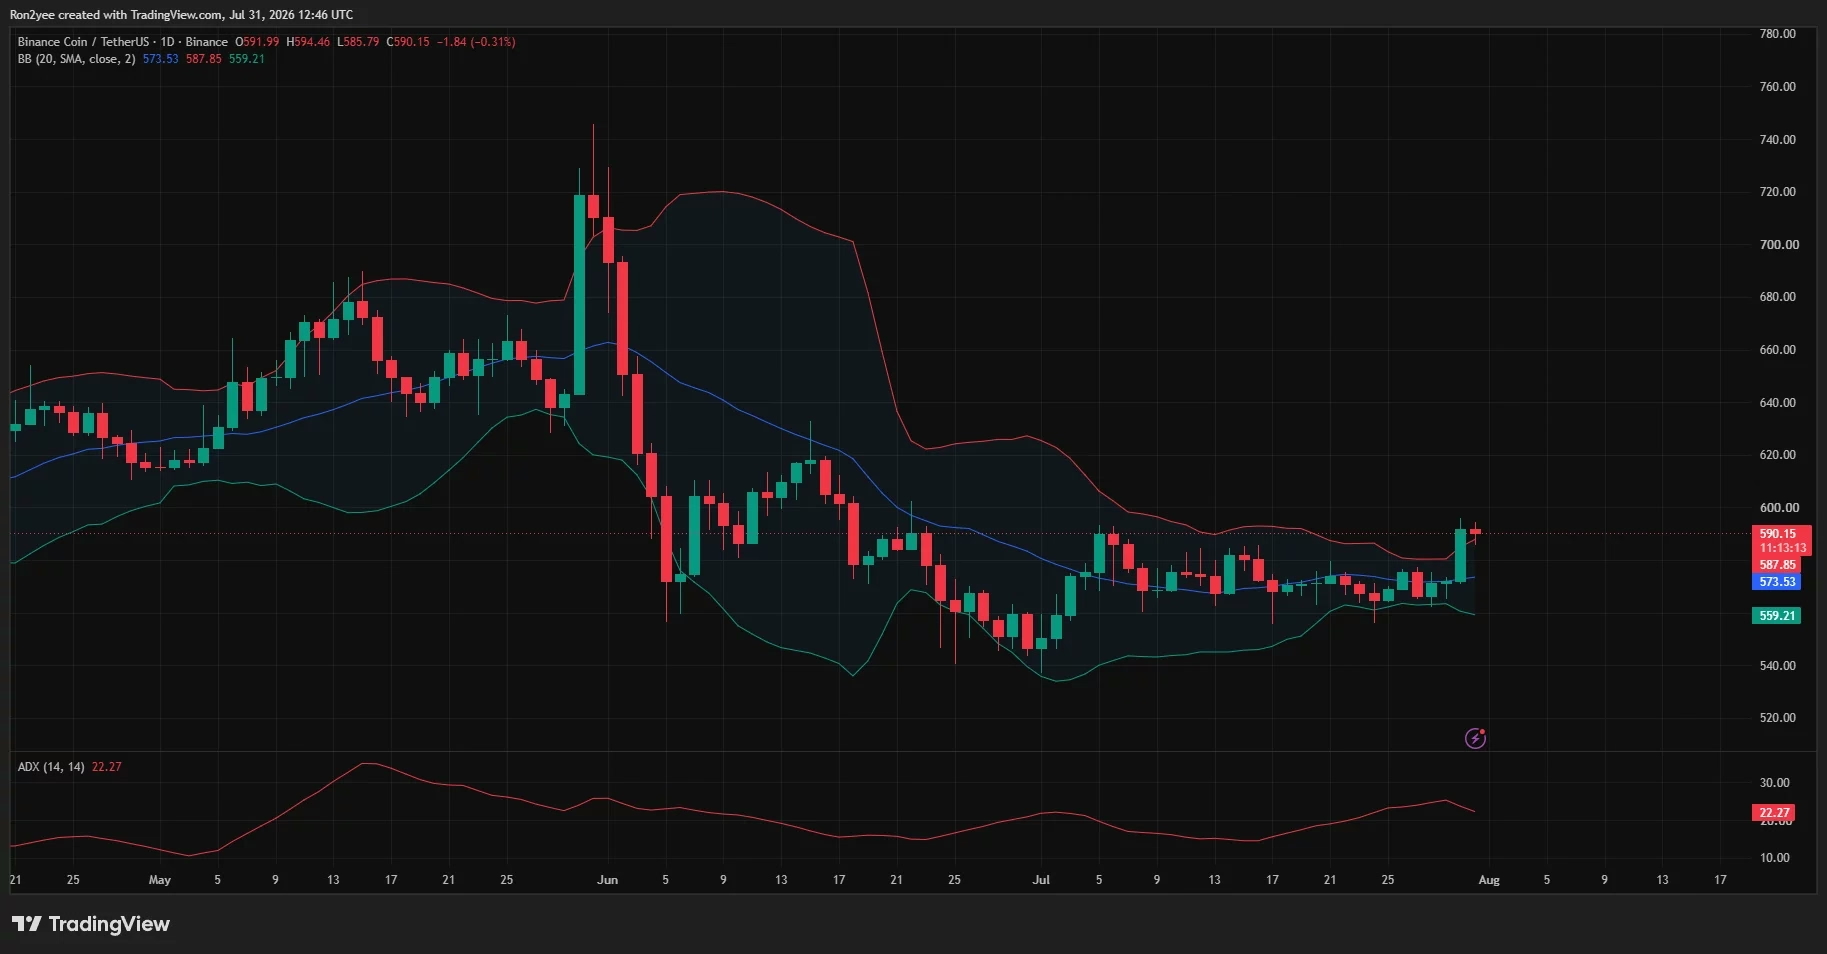
On the daily timeframe, BNB closed near $590.15, positioning itself above the Bollinger Band's upper boundary at $587.85. While this reflects strong buying pressure, it also raises the possibility of mean reversion. A daily close back inside the band could redirect focus toward the middle band at $573.53 as a potential pullback target.
Liquidity Clusters Define the Battleground 💧
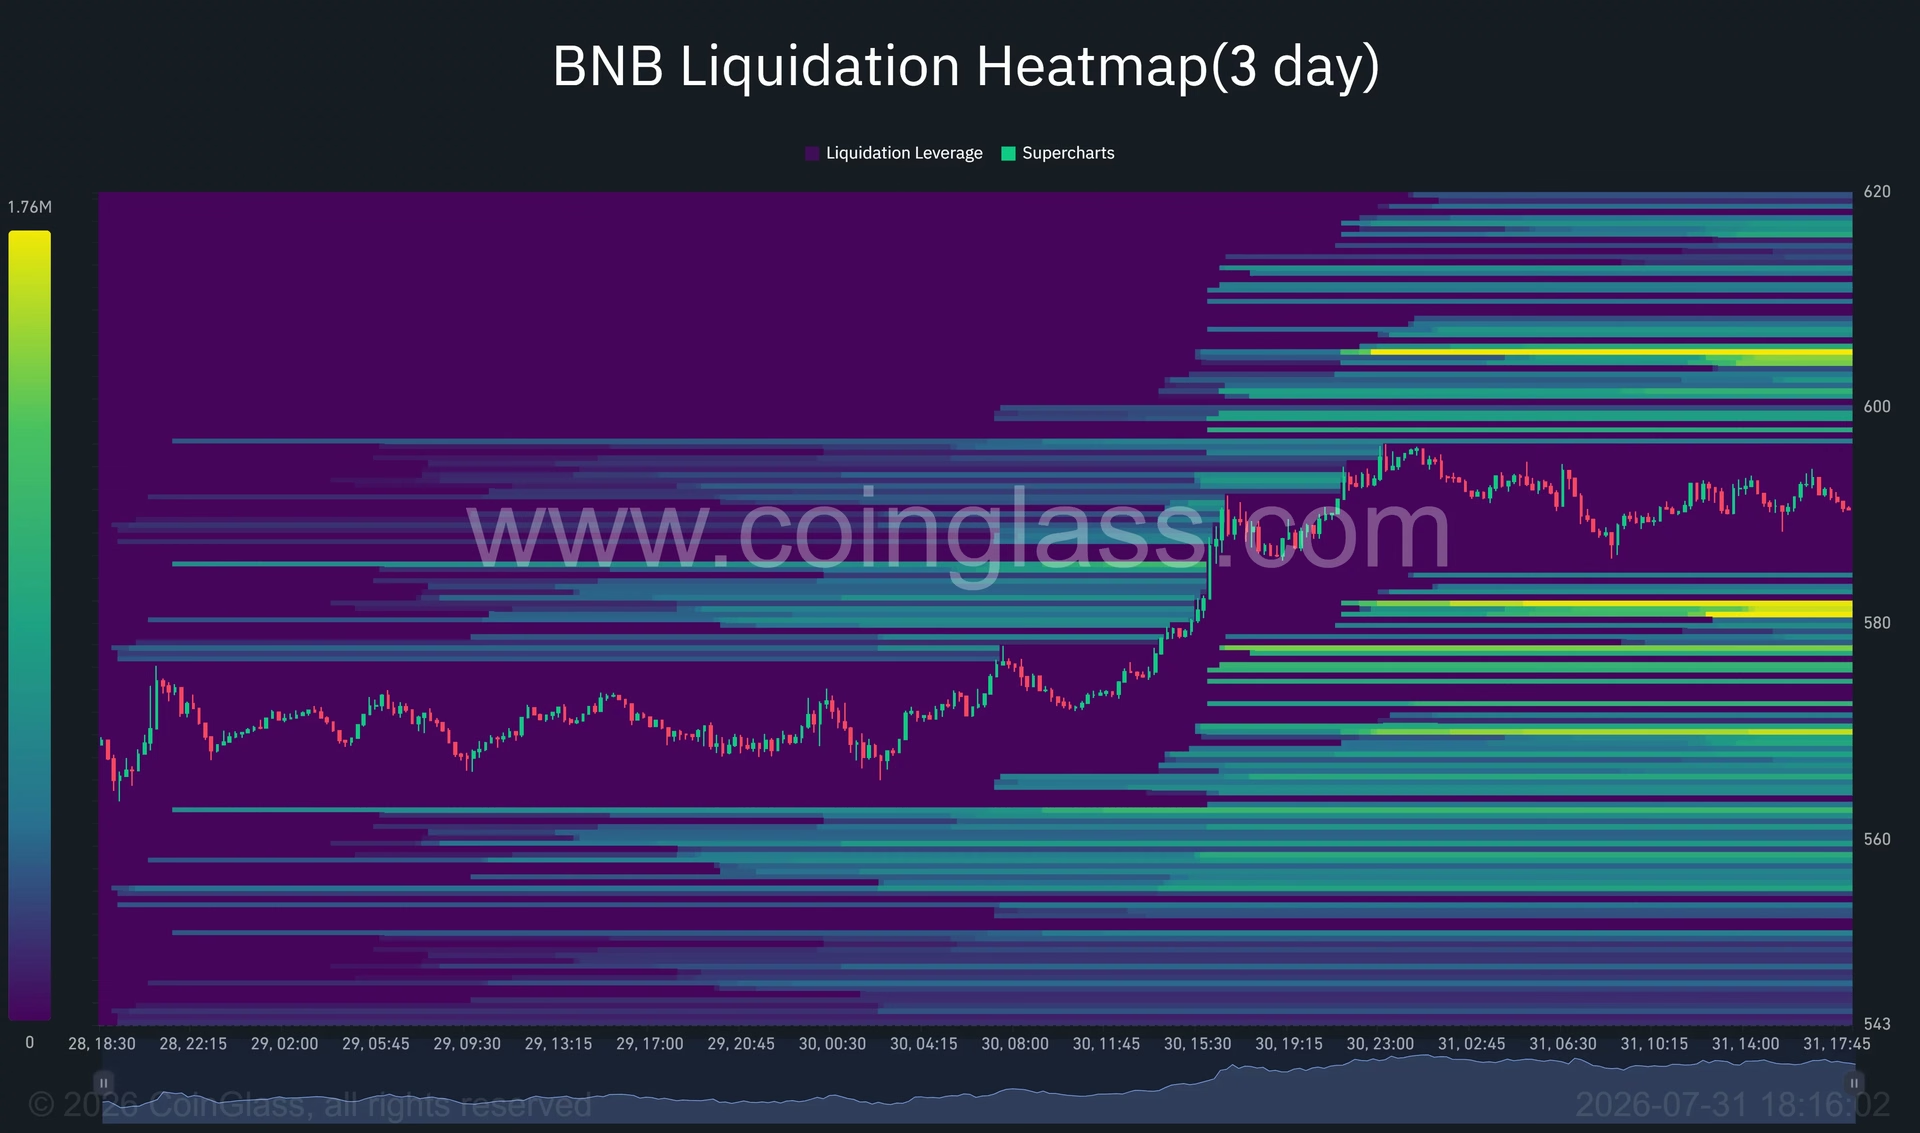
Understanding where the real money sits is crucial for predicting BNB's next move. The 3-day liquidation heatmap reveals a dense concentration of leveraged positions clustered between $605-$610. This liquidity cluster presents a double-edged sword: it could attract price if BNB clears $600, but it may also trigger significant volatility as short liquidations and profit-taking occur simultaneously.
Immediate support levels are equally critical to monitor. The $587-$580 zone represents the first line of defense, with the brightest nearby liquidity concentration appearing around $580-$582. Should the rally lose momentum, this area becomes a probable downside target. Below $580, the Bollinger midline near $573.53 emerges as the next technical support, with further downside exposure to the $559-$560 range that aligns with July's established demand zone.
Fundamental Support From Network Activity 🔗
Beyond pure technical positioning, fundamental developments provide substantive reasons for cautious optimism. BNB Chain recently processed approximately $19 billion in weekly decentralized exchange volume, positioning it ahead of both Ethereum and Solana during the measured period. This metric underscores the ecosystem's continued relevance as a trading destination.
Network utilization has also shown encouraging signs, rising from roughly 17% to nearly 30%. Higher on-chain activity typically correlates with increased demand for the native token, as users require BNB to pay transaction fees across the blockchain.
The integration of SilentSwap added another compelling use case by introducing private cross-chain swaps to the ecosystem. These expanding functionalities create genuine reasons for sustained network activity and, by extension, continued demand for BNB tokens.
The $600 Hurdle: Psychological and Technical Significance 🎯
The $600 level represents far more than a round number. BNB has tested this broader resistance area multiple times since June, reaching nearly $598 on June 22 and approaching $594 in early July. Each previous attempt failed to produce a sustained move above this threshold, creating a psychological barrier in trader minds.
A decisive close above $610 would substantially strengthen the current breakout and open a route toward the former $620-$632 supply zone—the very region from which the descending trendline began. This would represent a complete reversal of the June-July downtrend and potentially signal the beginning of a sustained recovery.
Conversely, a retreat below $573 would weaken the breakout narrative considerably, suggesting that the latest advance was merely another failed breakout within a broader consolidation pattern.
Macro Headwinds Could Derail the Rally 🌍
BNB's near-term trajectory doesn't exist in a vacuum. US market conditions, geopolitical tensions, and energy price dynamics all influence capital flows into speculative assets. Elevated oil prices complicate the Federal Reserve's policy outlook by raising inflation concerns, potentially leading to a more restrictive interest-rate environment.
In such conditions, liquidity available for speculative assets—including altcoins like BNB—typically contracts. If Bitcoin and US technology stocks weaken as investors reduce risk exposure, BNB may struggle to sustain an independent rally regardless of its technical setup.
The Average Directional Index currently stands at 22.27, suggesting that the developing trend has moderate strength but hasn't yet reached the levels normally associated with a powerful directional move. This reading indicates that conviction remains somewhat muted despite the recent advance.
What Comes Next: Key Scenarios to Monitor 🔮
The near-term setup remains constructive as long as BNB holds above $580. However, the market now faces several critical junctures:
-
Bullish Scenario: A confirmed break through $600-$610 would favor continuation toward the $620-$632 supply zone, potentially validating the breakout and attracting fresh capital.
-
Neutral Scenario: Consolidation between $590-$600 would suggest that traders remain uncertain about the breakout's sustainability, with neither buyers nor sellers commanding clear control.
-
Bearish Scenario: A retreat below $573 would indicate that the latest move was another failed breakout attempt, resetting focus on the $559-$560 demand zone and extending the consolidation period.
The Verdict 💡
BNB's 5% rally represents a meaningful technical development after weeks of downside pressure, but the token's inability to definitively break above $600 leaves the outcome uncertain. The combination of positive network metrics and technical breakout signals is encouraging, yet stretched momentum indicators and formidable liquidity clusters at higher levels warrant caution.
For traders and investors, the current setup demands disciplined risk management. The $580 support zone represents a critical level—holding above it maintains the bullish narrative, while breaking below it would suggest the rally was premature. Success depends not only on BNB's independent strength but also on broader market conditions and investor risk appetite during a period of elevated uncertainty.
The coming days will reveal whether this breakout represents genuine momentum or merely another false start in what has been a frustrating sideways market for BNB holders. 📈
You May Also Like

Market Analysis
XRP Price Falls 5% as Leverage Hits Seven-Month High
August 26, 2026

Market Analysis
Crypto Market Hits Extreme Greed: What This Means for Bitcoin
August 26, 2026

Market Analysis
Ethereum Price Rally Overheats Below $2,550 Resistance
August 26, 2026

Market Analysis
Hyperliquid Price Rally: HYPE Targets $97 Amid $80 Support
August 25, 2026