Category:
Market AnalysisBNB Price Nears $600: Short Liquidations Threaten Market

🚀 BNB Approaches Critical Price Level as Market Dynamics Shift
Binance Coin (BNB) has captured renewed investor attention as it trades closer to the $600 psychological barrier, a development that carries significant implications for leveraged traders positioned on both sides of the market. Currently hovering near $590, the token has demonstrated impressive resilience after recovering approximately 4% over the past week from lows near $566. This rally represents more than just a temporary bounce—it signals a potential structural shift in market sentiment following a critical technical breakout.
The convergence of bullish technical signals, growing network fundamentals, and a massive concentration of short positions above $600 creates a volatile cocktail for traders and investors alike. Understanding the mechanics driving this move and the risks lurking at key resistance levels has become essential for anyone with exposure to this major altcoin.
📊 Breaking Through the Resistance: Technical Confirmation
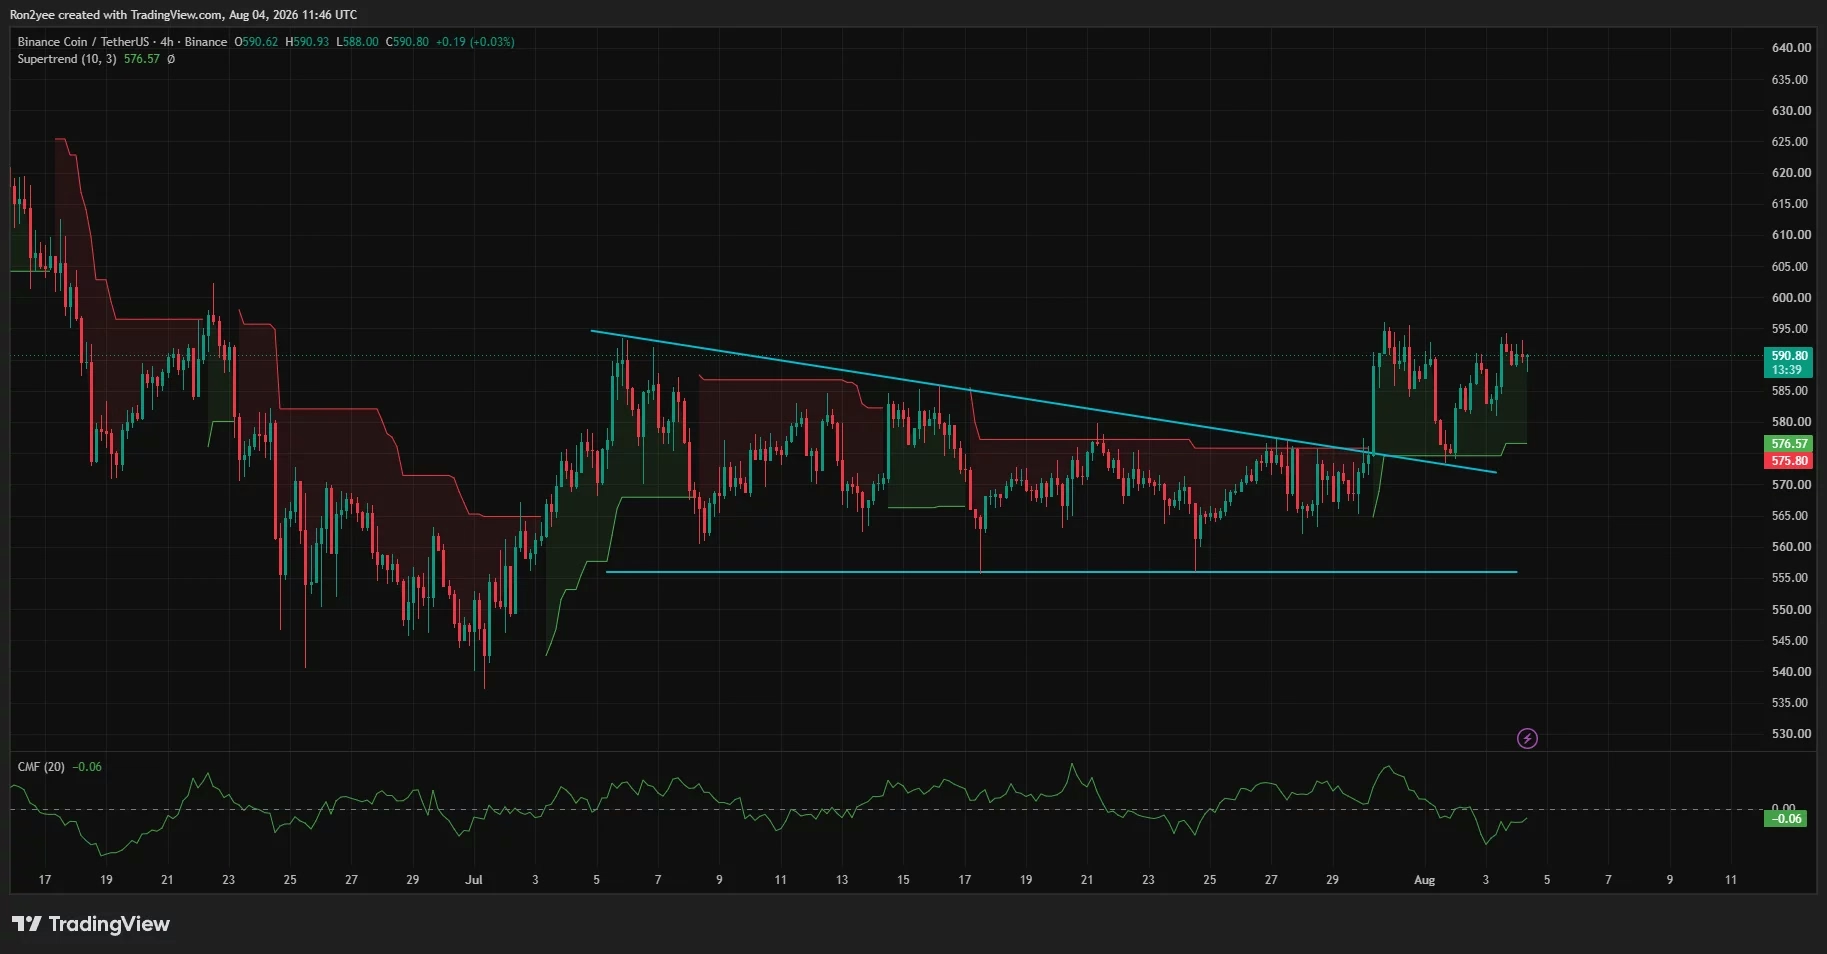
The technical picture for BNB has undergone a meaningful transformation in recent weeks. The token successfully broke above a descending trendline that had constrained its recovery since early July, a level that previously capped multiple bounce attempts. What makes this breakout particularly significant is that buyers have subsequently defended a retest of that same level near $576, effectively converting former resistance into support.
This price action represents textbook breakout confirmation—the kind of pattern that technical analysts view as validation of a directional shift. The 4-hour chart reveals that BNB continues to trade above the Supertrend indicator, currently positioned near $576.57, which reinforces the bullish short-term structure. The daily chart provides additional technical support at $581.62, a level corresponding to the 78.6% Fibonacci retracement of BNB's decline from its June peak of $745.33 down to the recent low of $537.05.
Holding above this Fibonacci level is crucial. A daily close below $581.62 would weaken the current bullish setup and potentially return the token to its previous consolidation range. Conversely, maintaining support at this level strengthens the case for continued upside momentum.
🔍 The Liquidation Landscape: Where Shorts Become Vulnerable
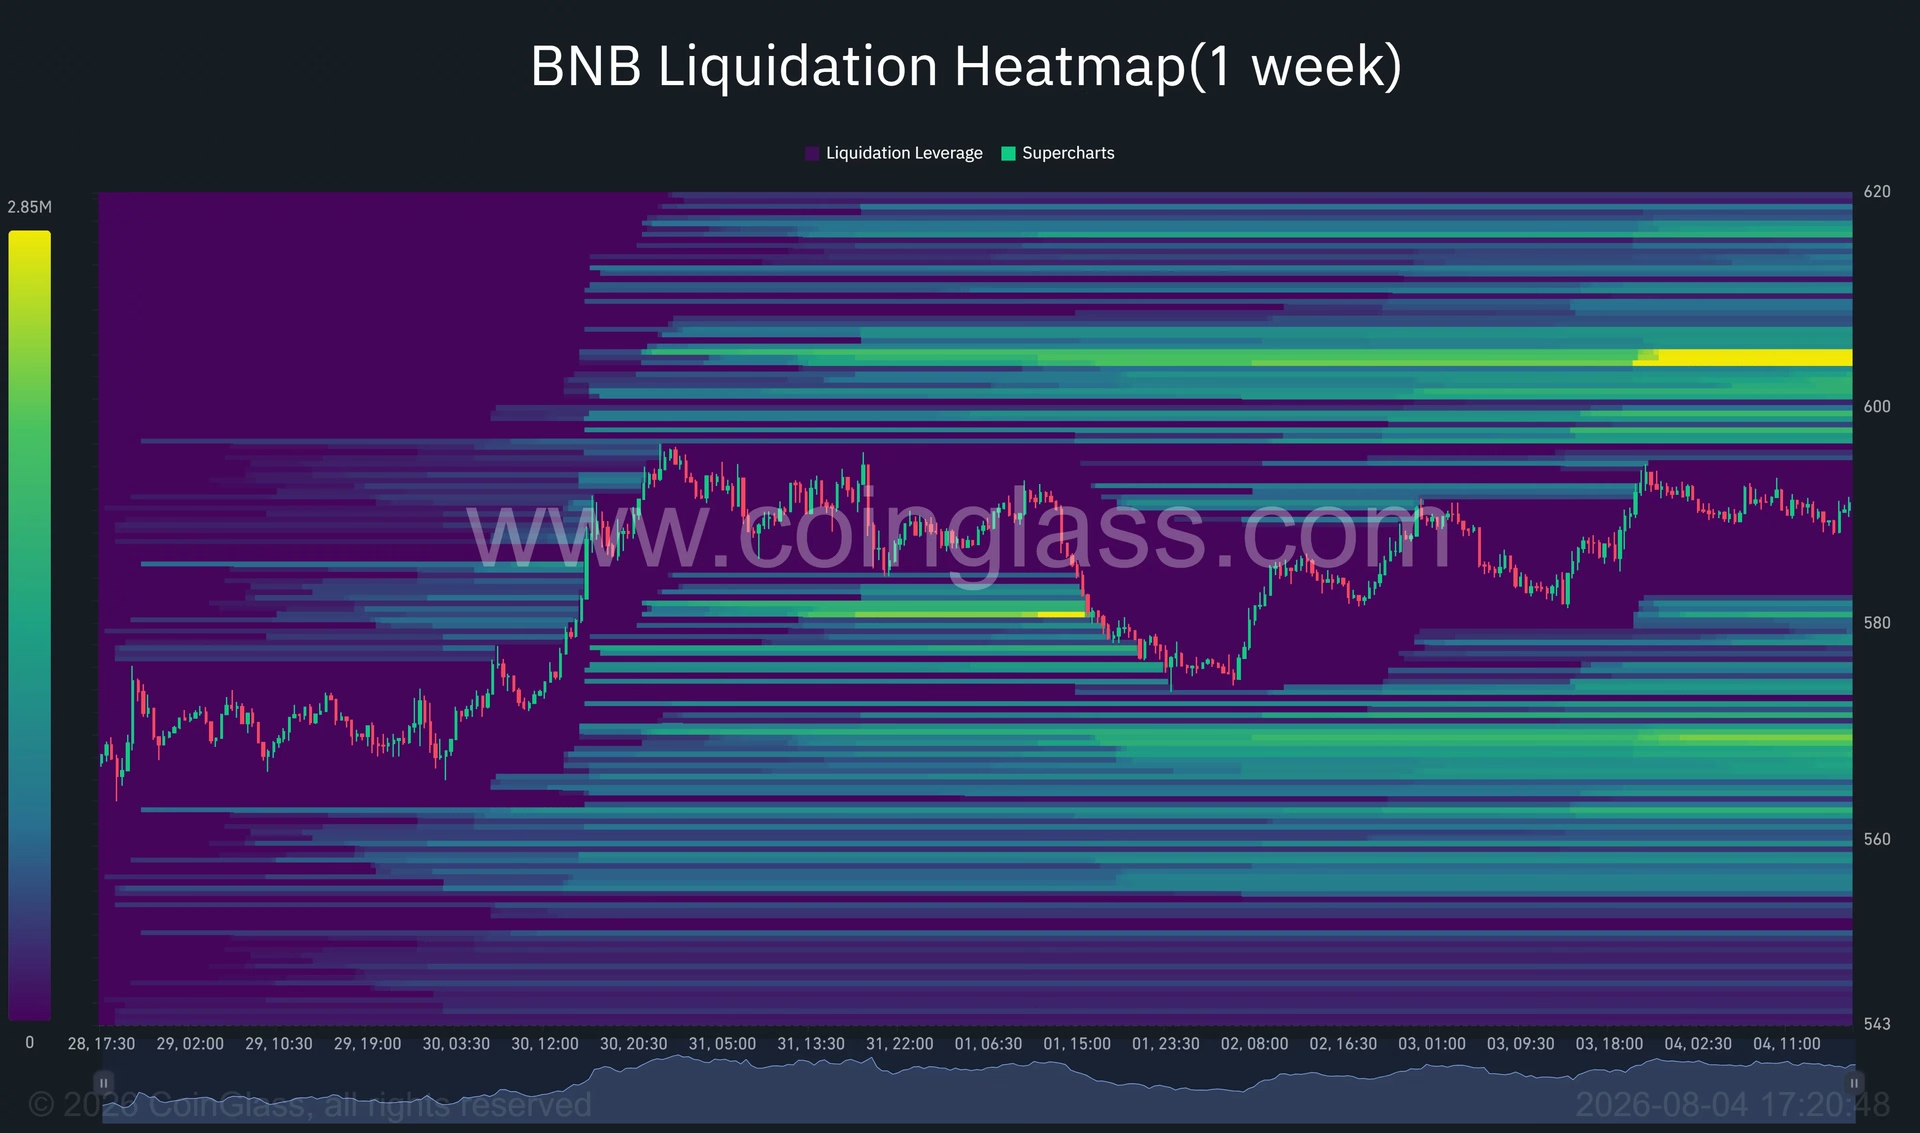
One of the most compelling aspects of the current BNB setup involves the distribution of leveraged positions across the market. The one-week liquidation heatmap reveals a striking concentration of short positions clustered between $605 and $610—precisely where BNB would need to move for a significant portion of bearish traders to face forced liquidations.
This dynamic creates what traders call a "liquidation cascade" scenario. When leveraged shorts are forced to cover their positions due to losses, they must purchase BNB to close their bets, which paradoxically creates additional buying pressure that pushes the price even higher. This mechanical dynamic can accelerate moves in ways that fundamental factors alone might not explain.
The presence of this liquidity cluster above $600 represents both opportunity and risk. For bulls, it suggests that a decisive break above $600 could trigger a cascade of liquidations that propels BNB toward $616.61, corresponding to the 61.8% Fibonacci retracement level. For bears and cautious traders, it serves as a warning that the current move contains elements of potential instability driven by leverage rather than organic demand.
💪 Fundamental Support: Network Activity Fueling Recovery
While technical patterns capture headlines, the underlying fundamentals supporting BNB's recovery deserve equal attention. BNB Chain has experienced a meaningful resurgence in network activity that extends beyond typical market cycles. During the measured period, the chain recorded approximately $19 billion in weekly decentralized exchange volume, positioning it ahead of both Ethereum and Solana—a remarkable achievement that underscores the ecosystem's growing competitiveness.
Network utilization metrics tell an equally compelling story. The chain's utilization rate has climbed from roughly 17% to nearly 30%, indicating substantially increased transaction throughput and user engagement. This elevation in network activity directly supports demand for BNB because the token functions as the primary mechanism for paying transaction fees and deploying smart contracts across the BNB Chain ecosystem.
The supply side of the equation has also shifted favorably. BNB Chain completed its 36th quarterly burn in July, removing approximately 1.62 million BNB tokens worth roughly $932 million at the time of the burn. This quarterly token reduction initiative leaves the total supply near 133.17 million BNB and provides a longer-term supply tailwind that could support price appreciation as demand grows.
These fundamental improvements have enabled BNB to outperform a largely range-bound altcoin market, suggesting that the token's recent strength stems from genuine ecosystem developments rather than pure speculative fervor.
📈 Technical Indicators Aligned with Bullish Bias
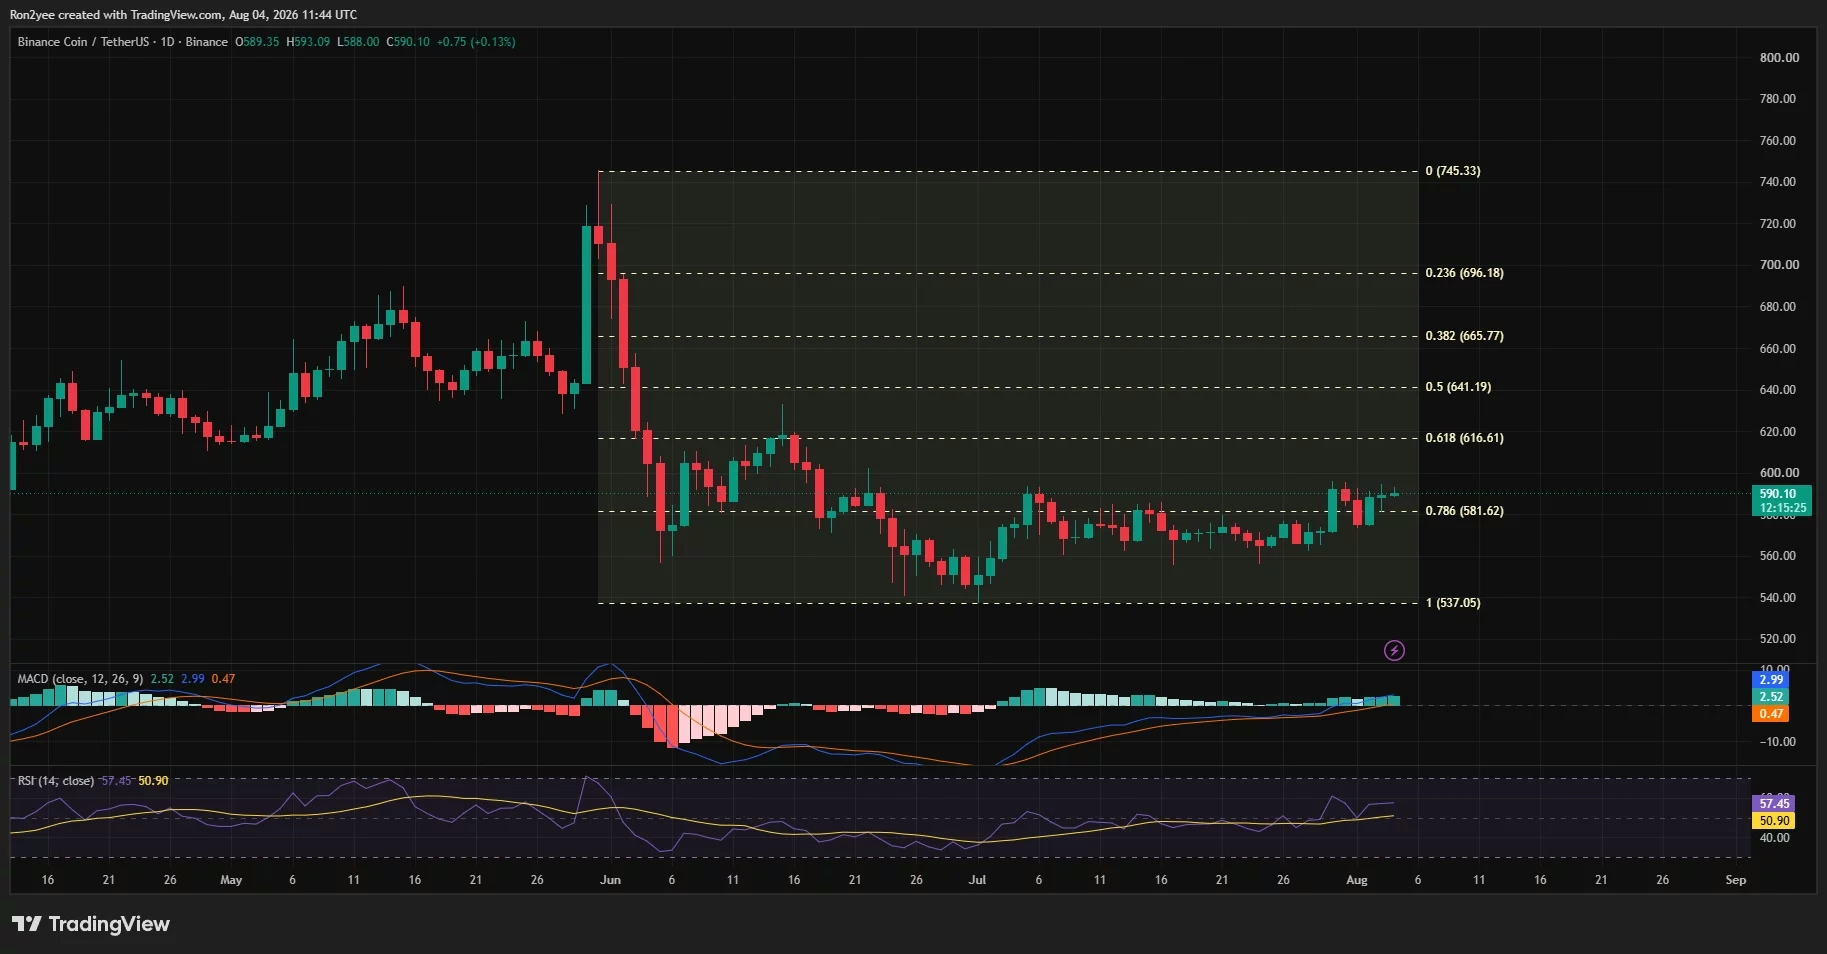
The technical indicators supporting BNB's current trajectory warrant detailed examination. The daily Moving Average Convergence Divergence (MACD) remains positioned favorably for bulls, with the MACD line trading above its signal line while the positive histogram stands near 0.47. This configuration indicates sustained bullish momentum without yet reaching the extreme readings that would suggest imminent pullbacks.
The Relative Strength Index (RSI) has climbed to 57.45, a reading that sits comfortably above its moving average of 50.90 but remains well below the overbought threshold of 70. This positioning provides room for additional upside before the token enters territory typically associated with exhaustion or pullbacks. The RSI's trajectory suggests the rally maintains healthy momentum without excessive leverage driving the move.
However, one cautionary note emerges from the Chaikin Money Flow indicator on the 4-hour chart, which remains positioned at -0.06. This reading indicates that capital inflows have not yet fully confirmed the price recovery at the intraday level, leaving the current advance somewhat vulnerable if buying volume fades or profit-taking emerges.
🎯 Critical Resistance Levels and Price Targets
The path forward for BNB hinges on a series of clearly defined technical levels that will determine whether the current rally sustains or reverses. The immediate battleground sits at $592, a level that has repeatedly functioned as resistance throughout 2026. The token has briefly traded above this area but has yet to establish a decisive daily close beyond it—a milestone that would carry significant psychological and technical weight.
A confirmed break above $592 would bring the $600 psychological barrier into focus, a round-number level that holds outsized importance in crypto markets. Beyond $600, the liquidation heatmap shows the largest concentration of short positions between $605 and $610. A move into this range would likely trigger forced liquidations that could accelerate the advance further.
If BNB successfully navigates through the short liquidation zone, the next meaningful chart-based target would sit at $616.61, corresponding to the 61.8% Fibonacci retracement. Beyond that level, additional resistance emerges at $641.19 and $665.77, levels that would require substantially stronger spot demand as BNB would be entering a broader supply zone created during its June decline.
⚠️ The Bearish Scenario: When Support Fails
While the technical setup currently favors buyers, prudent risk management requires understanding the downside scenarios that could invalidate the bullish thesis. The bearish case begins if BNB fails to overcome the $592 resistance and subsequently loses the $581.62 support level. In that scenario, the 4-hour Supertrend area between $575.80 and $576.57 would provide the next line of defense for bulls.
If selling pressure intensifies beyond that zone, the liquidation heatmap identifies additional liquidity near $567, while the 4-hour chart places major horizontal support near $556. A break beneath $556 would invalidate the current higher-low structure and expose the daily range floor around $537, essentially returning BNB to recent lows.
This downside scenario, while less probable given current technical positioning, remains entirely possible if external market conditions shift or if the buying volume supporting the current rally proves insufficient to overcome resistance.
🌍 External Risks: Macro Conditions and Fed Expectations
For investors in the United States and globally, BNB's breakout remains sensitive to broader macroeconomic conditions and Federal Reserve policy expectations. The relationship between Treasury yields, dollar strength, and altcoin demand has proven consistently inverse—when US interest rates rise or risk sentiment deteriorates, capital typically flows away from speculative assets like BNB.
Geopolitical pressures and elevated oil prices add another layer of complexity by keeping inflation concerns active in market discourse. Should these conditions drive US rate expectations higher, BNB may struggle to attract sufficient capital for a sustained move through $600, regardless of how compelling the technical setup appears.
The broader cryptocurrency market remains vulnerable to sudden shifts in macro sentiment that can overwhelm even strong fundamental and technical cases. Traders should monitor Treasury yield movements, Federal Reserve communications, and global risk sentiment as key indicators that could influence BNB's trajectory.
🔮 What Analysts Are Saying
The technical community has largely embraced the bullish interpretation of BNB's breakout. Prominent analysts have highlighted that the token has reclaimed its 50-day moving average and successfully retested the breakout zone, a sequence that traditionally opens the door to significant upside moves. The consensus view suggests that flipping the $592 resistance into support would substantially strengthen the case for a broader uptrend.
These analyst perspectives align with the technical evidence, though it's important to remember that even strong technical setups can fail if external conditions shift or if leverage unwinds unexpectedly.
📌 Key Takeaways and What to Watch
For the bullish case to remain intact:
- BNB must hold above the $581.62 daily support level
- A daily close above $592 would significantly improve upside probability
- Movement into the $605–$616 region would likely trigger short liquidations that accelerate gains
For the bearish case to develop:
- A loss of $592 resistance would weaken the bullish structure
- A break below $581.62 would invalidate the current higher-low pattern
- Failure to hold $576 support would return BNB to its previous consolidation range
The current setup for BNB represents a fascinating intersection of technical, fundamental, and structural factors. The token's recovery above a descending trendline, combined with growing network activity and a massive concentration of short positions above $600, creates a scenario with meaningful upside potential. However, macroeconomic risks and the vulnerability of the move to fading buying volume warrant caution.
For now, the technical structure favors buyers while BNB remains above $581.62. The next few days will likely prove decisive in determining whether this breakout represents the beginning of a sustained recovery or merely a relief bounce within a broader downtrend. 🎯
You May Also Like

Market Analysis
XRP Price Falls 5% as Leverage Hits Seven-Month High
August 26, 2026

Market Analysis
Crypto Market Hits Extreme Greed: What This Means for Bitcoin
August 26, 2026

Market Analysis
Ethereum Price Rally Overheats Below $2,550 Resistance
August 26, 2026

Market Analysis
Hyperliquid Price Rally: HYPE Targets $97 Amid $80 Support
August 25, 2026