Category:
Market AnalysisBNB Price Targets $610 as Open Interest Surges

BNB Breaks Free: A Technical Breakout Worth Watching 📈
Binance Coin (BNB) has captured the attention of crypto traders and analysts worldwide, trading near the $600 mark on August 5th after successfully escaping a month-long consolidation pattern. This breakout represents more than just a price movement—it signals renewed institutional interest and growing derivative market participation that could push the token significantly higher.
The cryptocurrency market has been closely monitoring BNB's technical setup, and recent developments suggest we may be witnessing the early stages of a meaningful rally. With open interest climbing and liquidation clusters forming at predictable levels, traders are positioning themselves for what could be a substantial move toward the $610 resistance zone.
The Recovery Story: From $560 to $600 🚀
BNB's journey over the past week tells an encouraging story for bullish investors. The token gained approximately 5% in weekly trading, successfully reclaiming the psychologically important $592 support level that had been tested multiple times throughout July. This wasn't a random bounce—it represented a decisive break above critical moving average resistance.
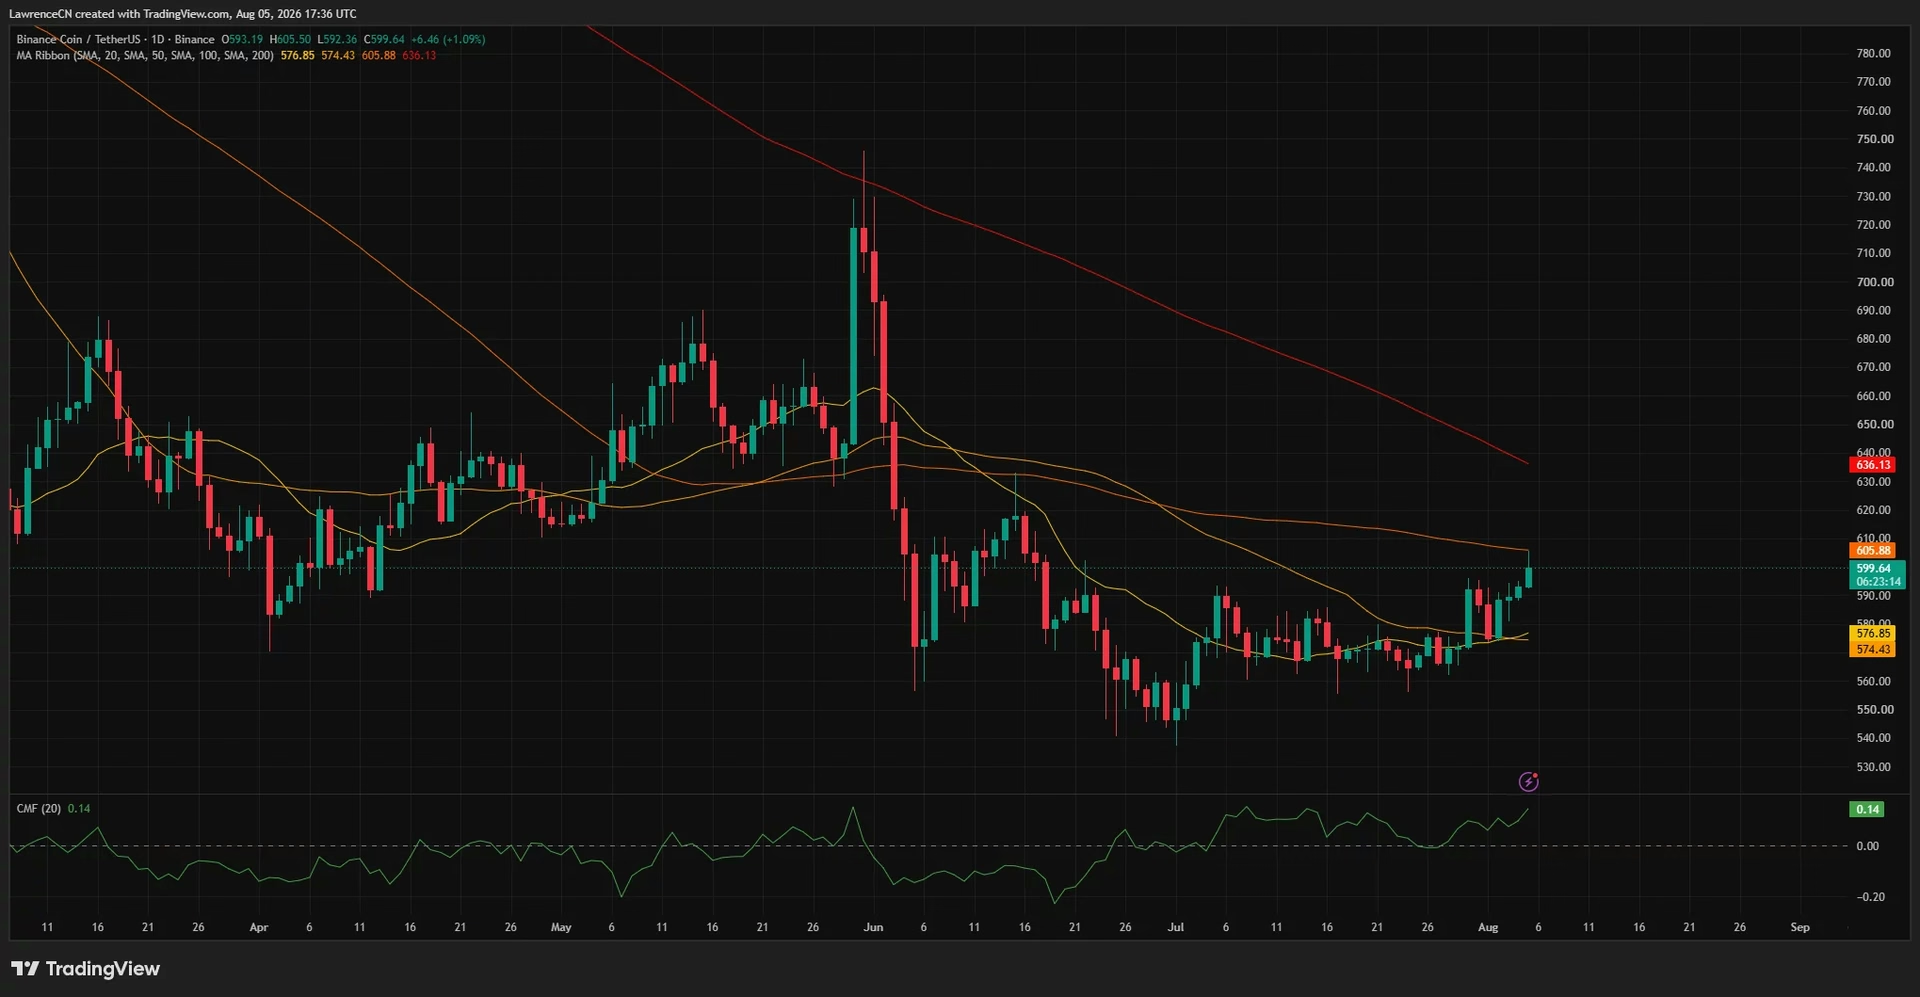
The daily chart reveals BNB closed near $599.64 after touching an intraday high of $605.50, demonstrating genuine buying pressure rather than fleeting momentum. More importantly, the token surpassed both its 20-day simple moving average ($574.43) and 50-day SMA ($576.85), establishing a cleaner technical structure that supports continued upside potential.
What makes this breakout particularly significant is the context of the broader crypto market. Bitcoin was approaching $64,000 during this period, while the total cryptocurrency market capitalization rose 0.72% to approximately $2.19 trillion. This environment of rising tides provides favorable conditions for altcoin outperformance.
Derivatives Market Heating Up: A Sign of Serious Interest 🔥
One of the most compelling indicators supporting BNB's bullish case comes from the derivatives market, where activity has accelerated dramatically. Derivatives trading volume surged 56.1% to reach $719.9 million, while open interest climbed 4.05% to $985.79 million—a substantial figure that reflects genuine trader conviction.
When price increases alongside rising open interest, it typically indicates that traders are establishing new long positions rather than simply closing existing contracts. This distinction matters tremendously because it suggests fresh capital entering the market with bullish conviction, not just profit-taking from earlier gains.
The implications are clear: if BNB can maintain this momentum and break through immediate resistance zones, the accumulated leverage in the derivatives market could amplify the move. Conversely, sharp reversals through key levels could trigger forced liquidations that create additional volatility.
Technical Resistance: The $602-$606 Zone 📊
The four-hour timeframe reveals BNB trading near the upper Bollinger Band, with the band positioned at $602. This proximity to an overbought indicator raises important questions about near-term sustainability, though the Relative Strength Index (RSI) reading of 63.74 suggests momentum remains bullish without reaching truly extreme overbought territory.
The convergence of multiple technical indicators at the $605.88 level creates a critical decision point. This level represents where the four-hour Bollinger Band middle line meets the daily 100-day simple moving average—a confluence that often acts as either a springboard for further gains or a rejection point for consolidation.
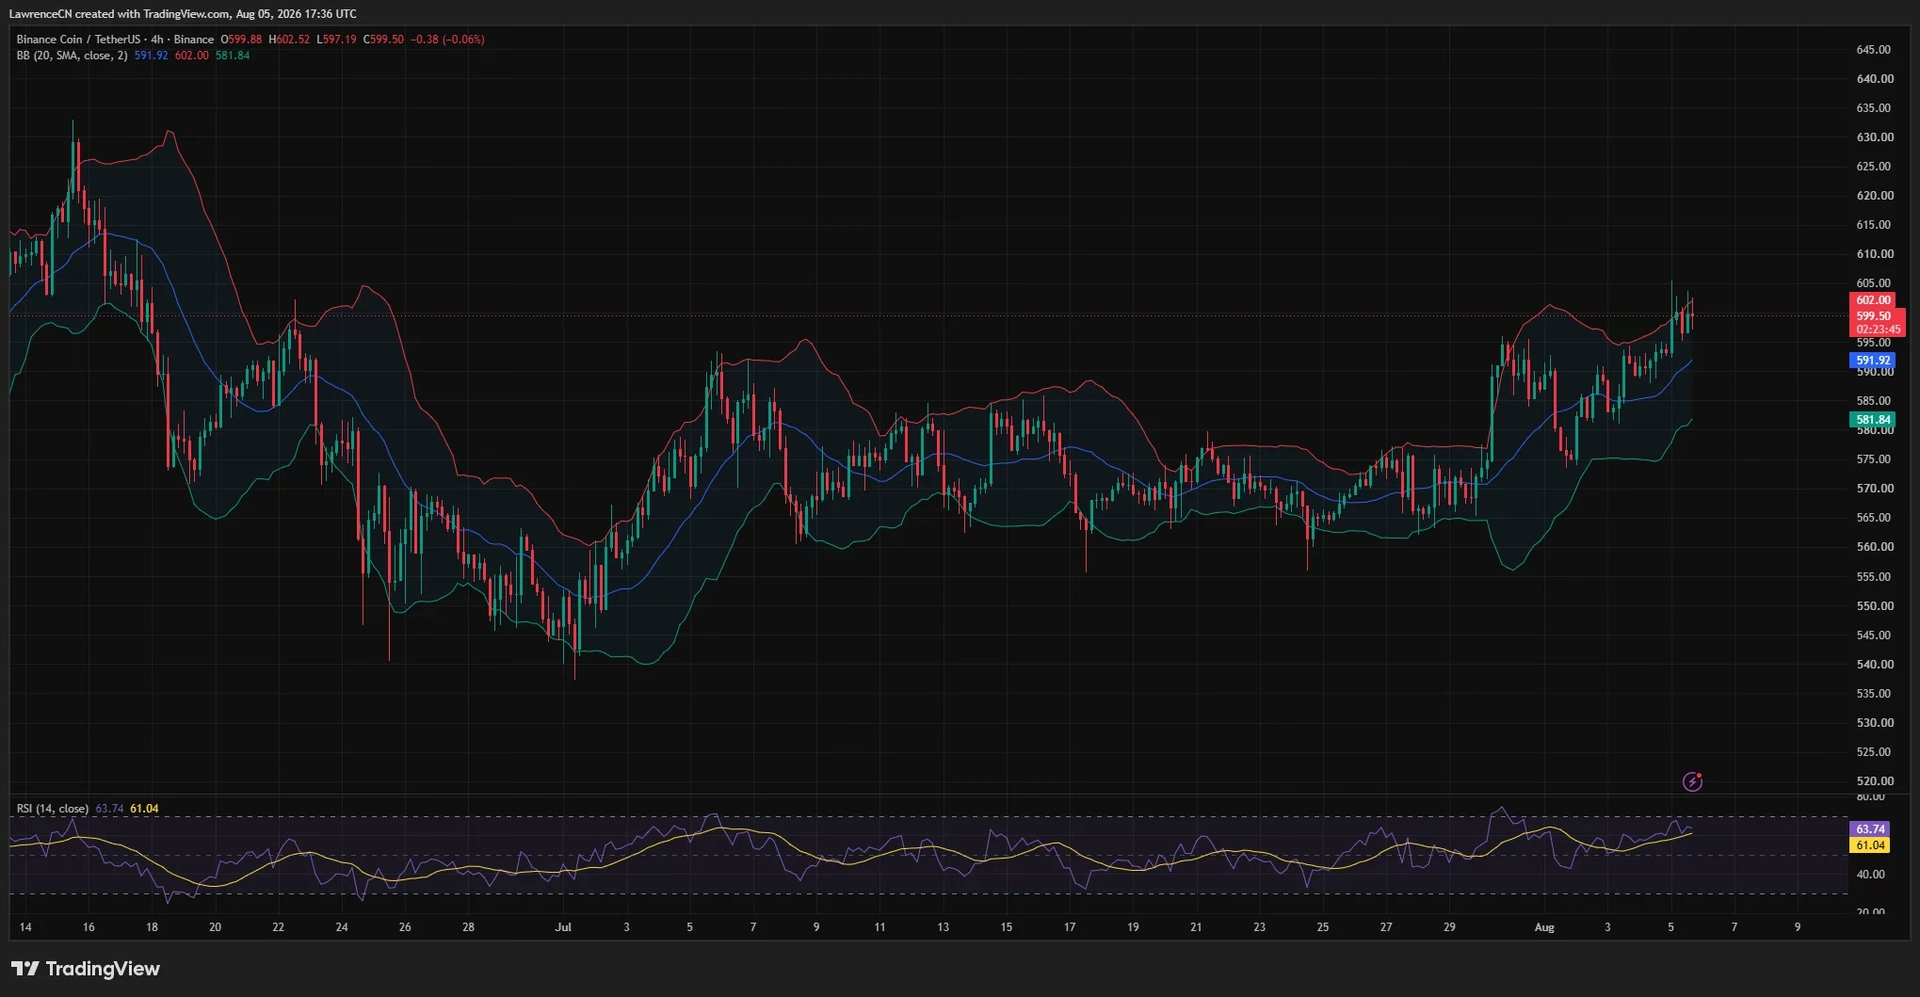
Price briefly moved above the upper band before retreating toward $599.50, indicating that sellers remain active in the $602-$606 range. This seller activity shouldn't be interpreted as weakness—rather, it represents profit-taking and resistance that must be overcome for the rally to extend meaningfully.
The $610-$616 Target Zone: Where Liquidity Clusters 🎯
If BNB successfully closes above $605.88 on the four-hour chart, the next significant price target materializes between $612 and $616. This isn't arbitrary speculation—this zone represents where the three-day liquidation heatmap shows two of the strongest overhead liquidity concentrations.
Liquidity clusters function as price magnets in volatile markets. When price approaches these zones, traders holding leveraged short positions face pressure to close their contracts, which paradoxically creates additional buying pressure. This dynamic can accelerate moves through these levels if sentiment remains constructively bullish.
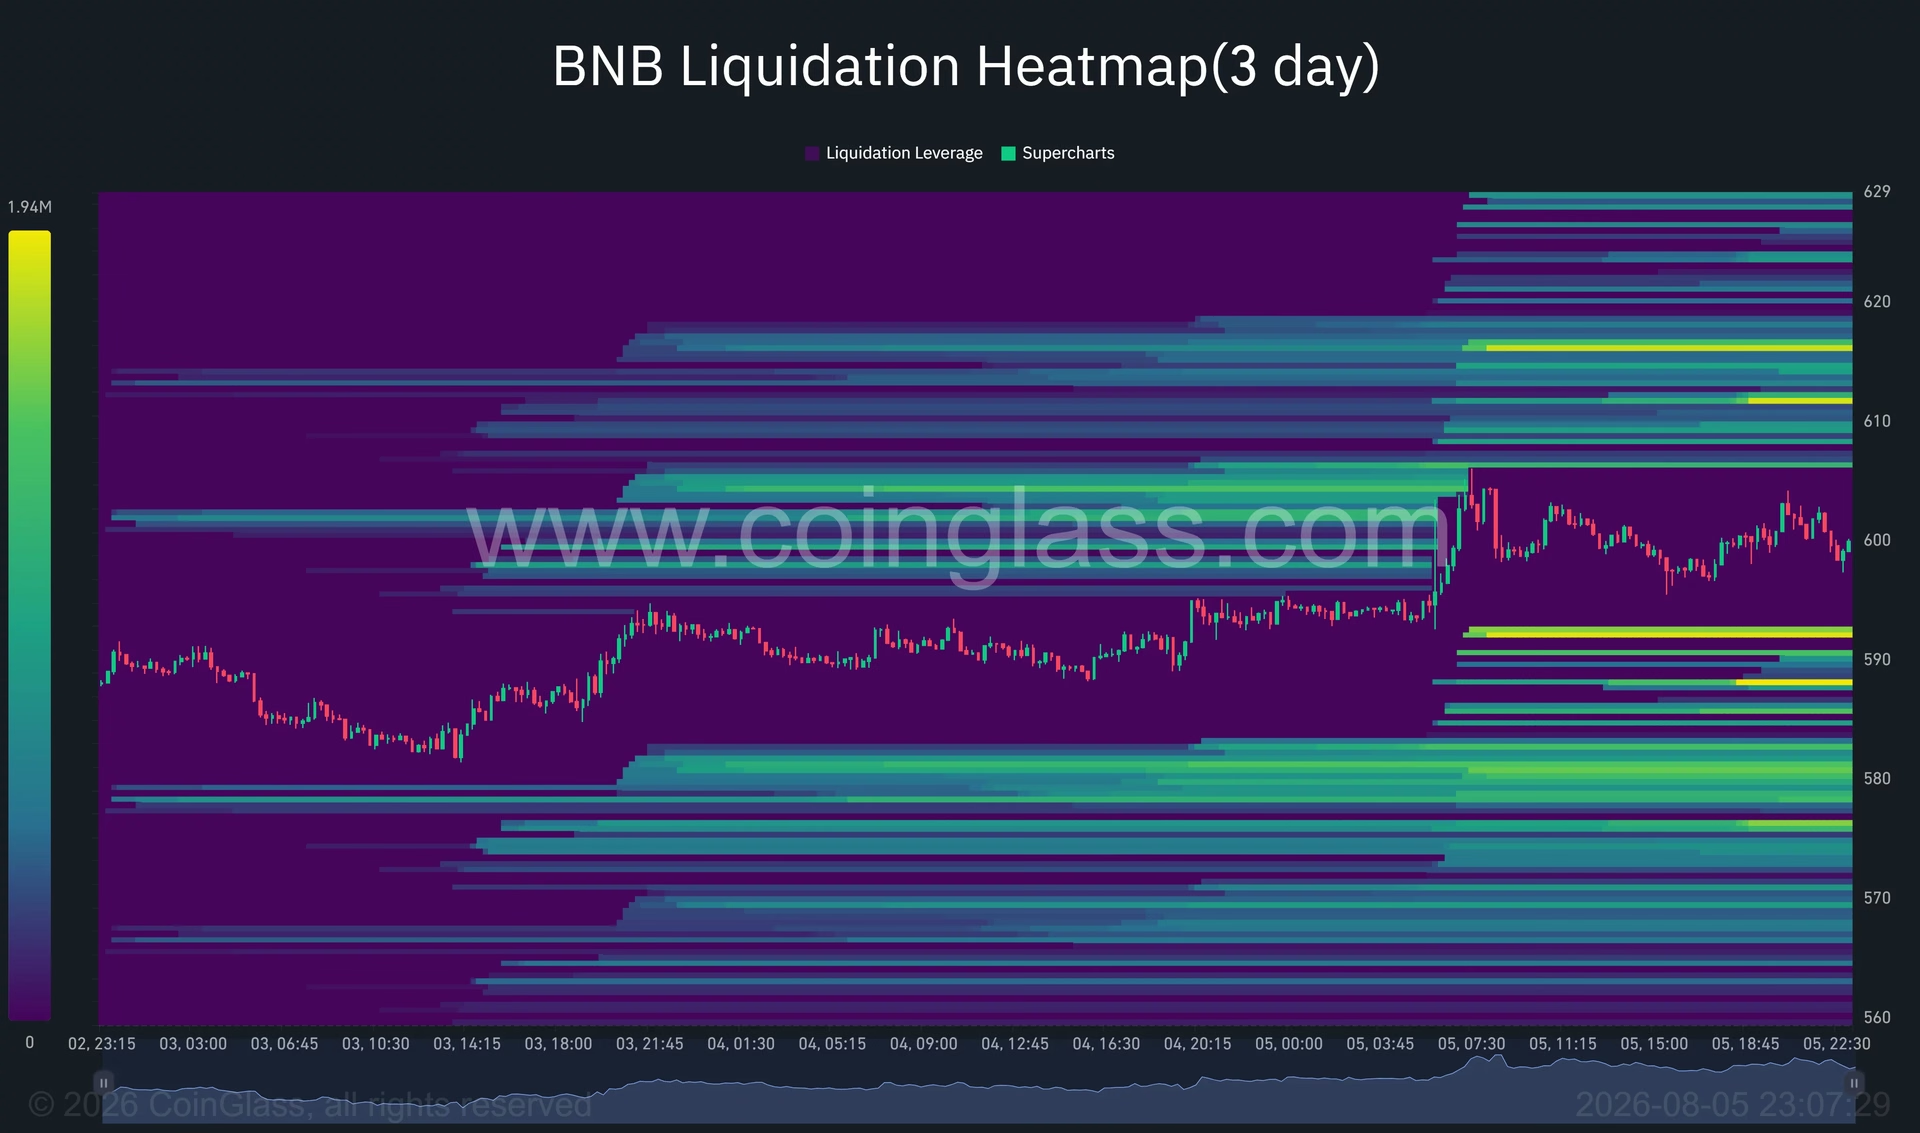
The $610 target that headlines have focused on sits right at the threshold of this major liquidity zone. Reaching this level would represent approximately a 1.7% gain from the $600 trading level, a modest but meaningful move that could establish momentum for further advances.
Support Levels: The Foundation of the Bullish Case 🛡️
While upside targets capture headlines, understanding downside protection proves equally important for risk management. The $592 level has emerged as the critical support that validates the entire bullish narrative.
Crypto analyst Satoshi Stacker identified $592 as one of BNB's most important levels for 2026, emphasizing that holding above this support level would confirm an emerging uptrend rather than a temporary recovery bounce. This distinction carries enormous weight for traders considering position sizing and risk parameters.
Below $592, initial support materializes at the four-hour Bollinger Band middle line near $591.92. A deeper breakdown would target the lower band at $581.84, followed by larger liquidation clusters around $581 and $576. These downside levels represent approximately 3-5% declines from current prices, providing reasonable risk-reward ratios for bullish traders.
The Chaikin Money Flow Signal 💰
Beyond moving averages and Bollinger Bands, the Chaikin Money Flow indicator adds credibility to the bullish setup. This metric rose to 0.14 on the daily chart, a reading above zero that indicates buying pressure has exceeded selling pressure during the measured period.
Chaikin Money Flow measures the relationship between price movement and volume, providing insight into whether accumulation or distribution is occurring. A reading above zero during a price rally suggests that volume is supporting the advance rather than declining as price rises—a positive sign for continuation.
Broader Market Context: Regulatory Tailwinds 📜
While BNB's technical setup provides the primary catalyst for the current rally, broader market developments offer supporting context. European regulatory progress through MiCA (Markets in Crypto-Assets) register updates added more authorized crypto-asset service providers, improving the institutional backdrop for cryptocurrency trading and custody.
Though this regulatory development doesn't provide a direct fundamental catalyst for BNB specifically, it reflects a broader trend toward legitimization and institutional adoption of cryptocurrency infrastructure. Such developments tend to improve sentiment and risk appetite across the entire sector.
What Traders Should Monitor 👀
Bullish Scenario:
- A confirmed four-hour close above $605.88 would bring $610-$616 into focus
- Short liquidations above $606 could accelerate the move toward $612
- Holding above $592 would confirm the uptrend remains intact
- Weekly closes above $600 would establish a new higher base for further advances
Bearish Scenario:
- A close back below $592 would weaken the bullish setup considerably
- Failure at $605.88 resistance could trigger consolidation or pullback
- Loss of $582 support would target the $576 level and potentially break the recent breakout
- Declining open interest alongside price weakness would signal weakening conviction
The Bottom Line: Momentum Meets Structure ✨
BNB's current setup represents an attractive technical opportunity for traders seeking exposure to a well-structured breakout with defined risk parameters. The combination of price recovery, rising derivatives activity, and bullish technical indicators creates a compelling narrative for continued upside toward $610 and beyond.
However, cryptocurrency markets remain inherently volatile, and resistance at $605.88 should not be underestimated. The $592 support level provides a clear line in the sand—as long as BNB holds above this level, the bullish case remains intact. Traders should maintain disciplined risk management and respect the defined support and resistance levels that technical analysis has identified.
The coming days will prove critical in determining whether BNB extends its rally or enters another consolidation phase. Watching for a sustained close above $605.88 and monitoring derivative liquidation activity will provide key signals for positioning decisions.
You May Also Like

Market Analysis
XRP Price Falls 5% as Leverage Hits Seven-Month High
August 26, 2026

Market Analysis
Crypto Market Hits Extreme Greed: What This Means for Bitcoin
August 26, 2026

Market Analysis
Ethereum Price Rally Overheats Below $2,550 Resistance
August 26, 2026

Market Analysis
Hyperliquid Price Rally: HYPE Targets $97 Amid $80 Support
August 25, 2026