Category:
Market AnalysisEthereum Dips Below $1,900 Amid Liquidation Surge

Ethereum's recent price movement has caught the attention of investors and analysts alike, as the cryptocurrency slipped below the $1,900 mark. This decline is largely attributed to a surge in long liquidations, a phenomenon that has placed significant pressure on the digital asset's price trajectory.
Ethereum's Price Movement
On July 28, Ethereum (ETH) experienced a notable drop from an intraday high of $1,973 to approximately $1,873. This price action erased the gains from the day before, where Ethereum reached its highest level since early June. The drop below the $1,900 threshold was exacerbated by the failure to break the $1,975–$2,000 resistance zone, triggering forced selling.
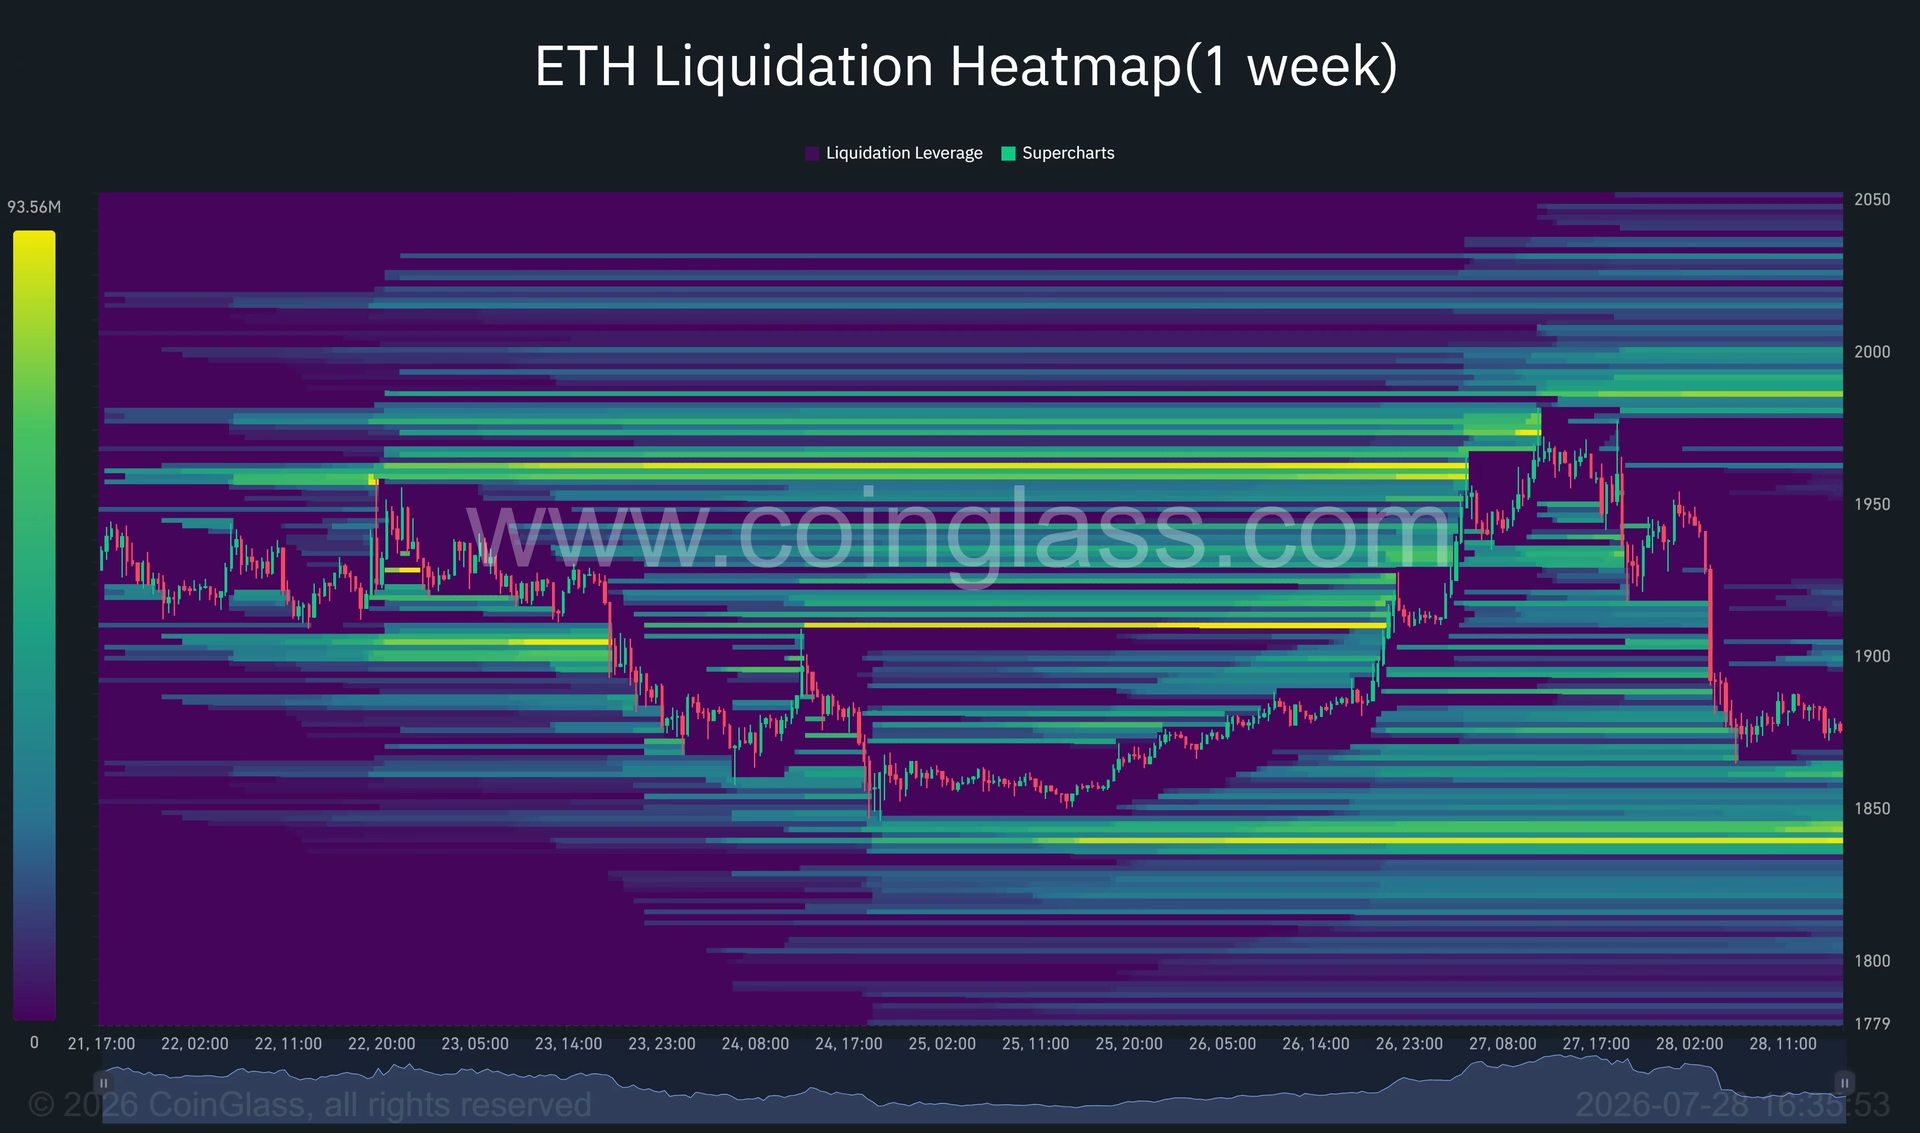
The forced selling was primarily due to leveraged positions that accelerated the decline. As Ethereum moved through several long-liquidation clusters, traders who had anticipated a breakout found themselves trapped, leading to stop-loss activations and position closures.
The Role of Liquidations
Liquidations have played a significant role in Ethereum's recent declines. The derivatives market, where traders often use leverage, has increased the speed of ETH's downturn. The one-week liquidation heatmap indicates that Ethereum passed through multiple areas of leveraged exposure between $1,950 and $1,890. This movement added sell orders as the price broke through these levels.
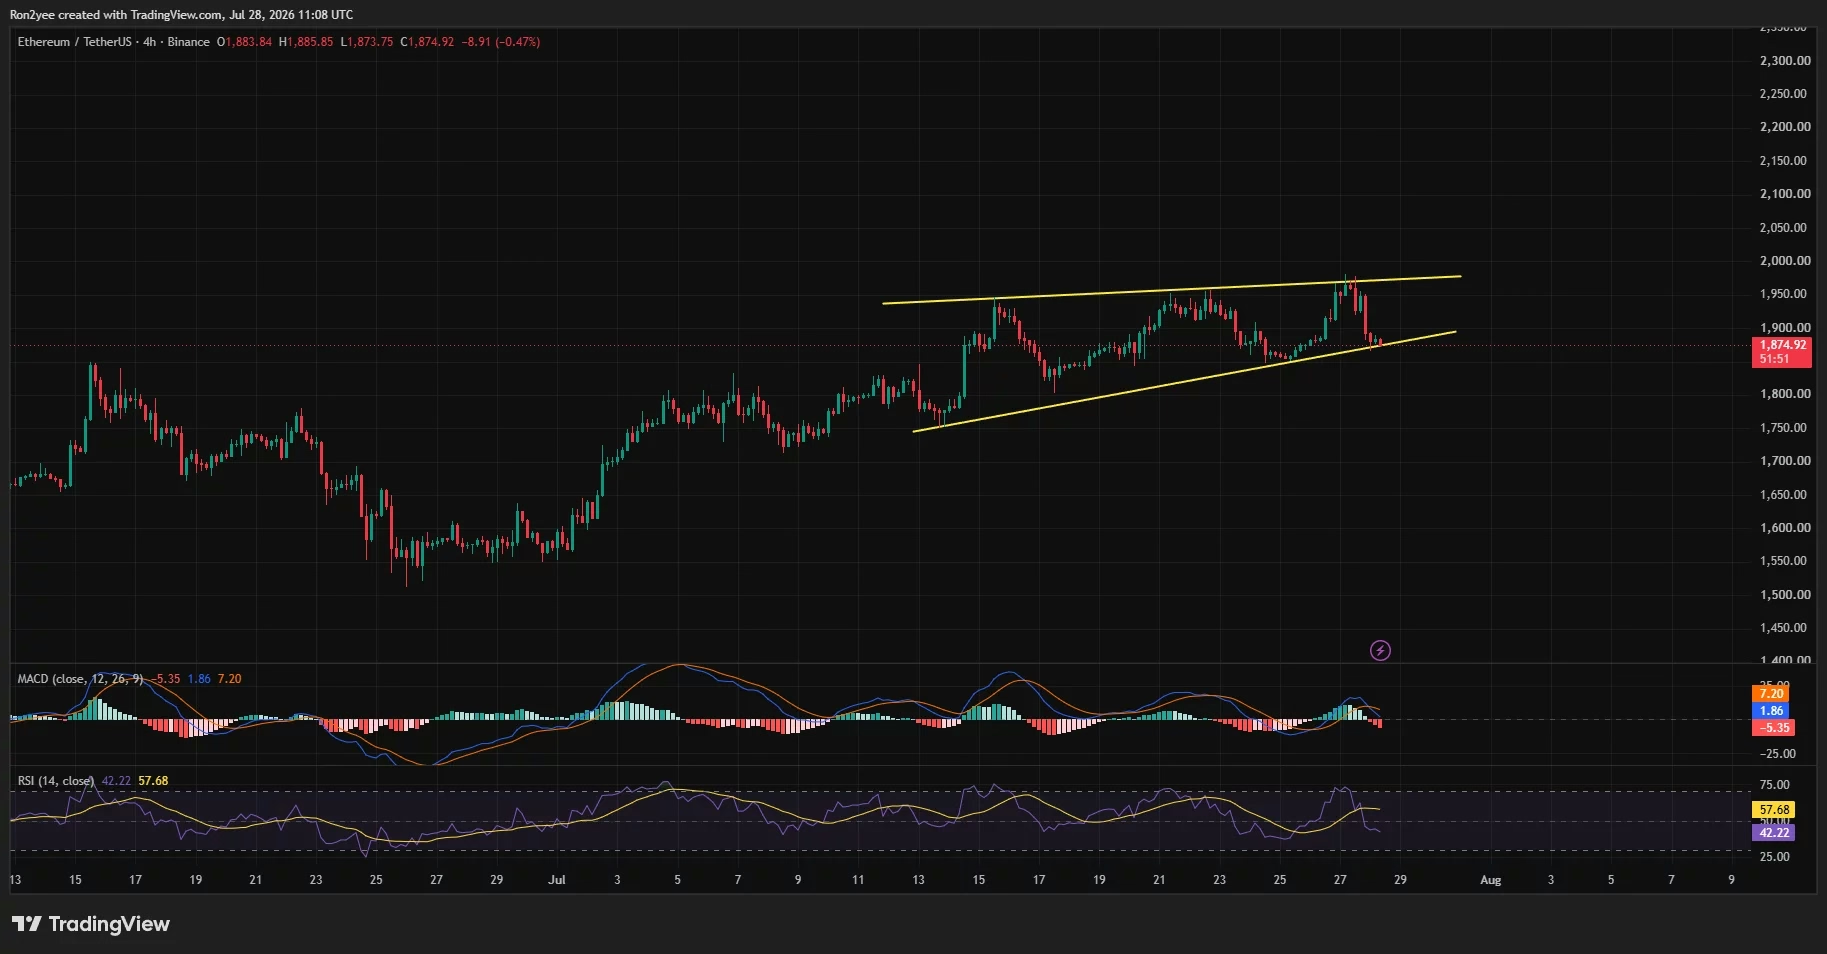
The current heatmap now points to a concentration of liquidity around $1,840–$1,850, suggesting that the price could gravitate towards this zone. However, this does not guarantee that ETH will necessarily reach these levels.
Broader Market Influences
Beyond liquidation dynamics, broader market factors have also pressured Ethereum. Weakness in technology stocks, coupled with concerns over the financial returns of artificial intelligence investments, has increased volatility in global equities. This has led investors to reduce exposure to risk assets, including cryptocurrencies.
In addition to these macroeconomic factors, transfers from large wallets to centralized exchanges have increased the amount of Ethereum available for sale. While these deposits do not confirm that holders have liquidated their assets, the increased supply adds to the selling pressure.
Technical Analysis and Future Outlook
Ethereum's technical indicators provide a mixed outlook. On the 4-hour chart, ETH is testing the lower boundary of a rising wedge near $1,870, a critical area for its next move. A decisive close below this trendline could weaken the token's recovery, potentially sending ETH towards the $1,850–$1,840 liquidity zone.
Momentum indicators, such as the relative strength index (RSI) and moving average convergence divergence (MACD), suggest a cautious short-term outlook. The RSI has fallen to 42.22, indicating weakening demand, while the MACD has turned bearish, with its line falling below the signal line.
Key Support and Resistance Levels
Crypto analyst Ted Pillows highlights the $1,840 area as a crucial support zone. If Ethereum holds above this level, it may continue to outperform Bitcoin. However, a breakdown below this support could redirect attention towards lower levels, such as $1,700 and $1,530.
Market commentator Rain notes that corporate accumulation could support Ethereum in the longer term. BitMine's recent purchase of nearly 10,000 ETH is a testament to institutional interest, even as short-term volatility persists.
Conclusion and Key Takeaways
Ethereum's recent dip below $1,900 underscores the impact of leverage and broader market dynamics on its price. As traders navigate these turbulent waters, the focus remains on key support levels and potential catalysts for recovery. While corporate buying may bolster ETH over time, short-term volatility demands careful monitoring of the $1,840–$1,870 region.
Looking ahead, investors should watch for signs of stabilization and any shifts in macroeconomic conditions that could influence risk appetite in the cryptocurrency market.
You May Also Like

Market Analysis
XRP Price Falls 5% as Leverage Hits Seven-Month High
August 26, 2026

Market Analysis
Crypto Market Hits Extreme Greed: What This Means for Bitcoin
August 26, 2026

Market Analysis
Ethereum Price Rally Overheats Below $2,550 Resistance
August 26, 2026

Market Analysis
Hyperliquid Price Rally: HYPE Targets $97 Amid $80 Support
August 25, 2026