Category:
Market AnalysisEthereum Price Breakout Risks Pullback With RSI at 86

Ethereum has experienced a dramatic surge that's capturing the attention of traders and analysts worldwide. 🚀 The second-largest cryptocurrency climbed to approximately $2,448 on August 21, representing a stunning 20% gain over just one week. However, beneath this impressive rally lies a critical technical warning: the daily Relative Strength Index (RSI) has reached 86, signaling deeply overbought conditions that could precede a significant pullback.
Understanding Ethereum's Recent Breakout 📈
The recent Ethereum price action tells a compelling story of momentum collision with fundamental catalysts. ETH surged from below $2,000 to above $2,300 in just two trading sessions, breaking through multiple resistance levels that had constrained the asset since April. This wasn't merely a speculative spike—several powerful forces converged to drive this movement.
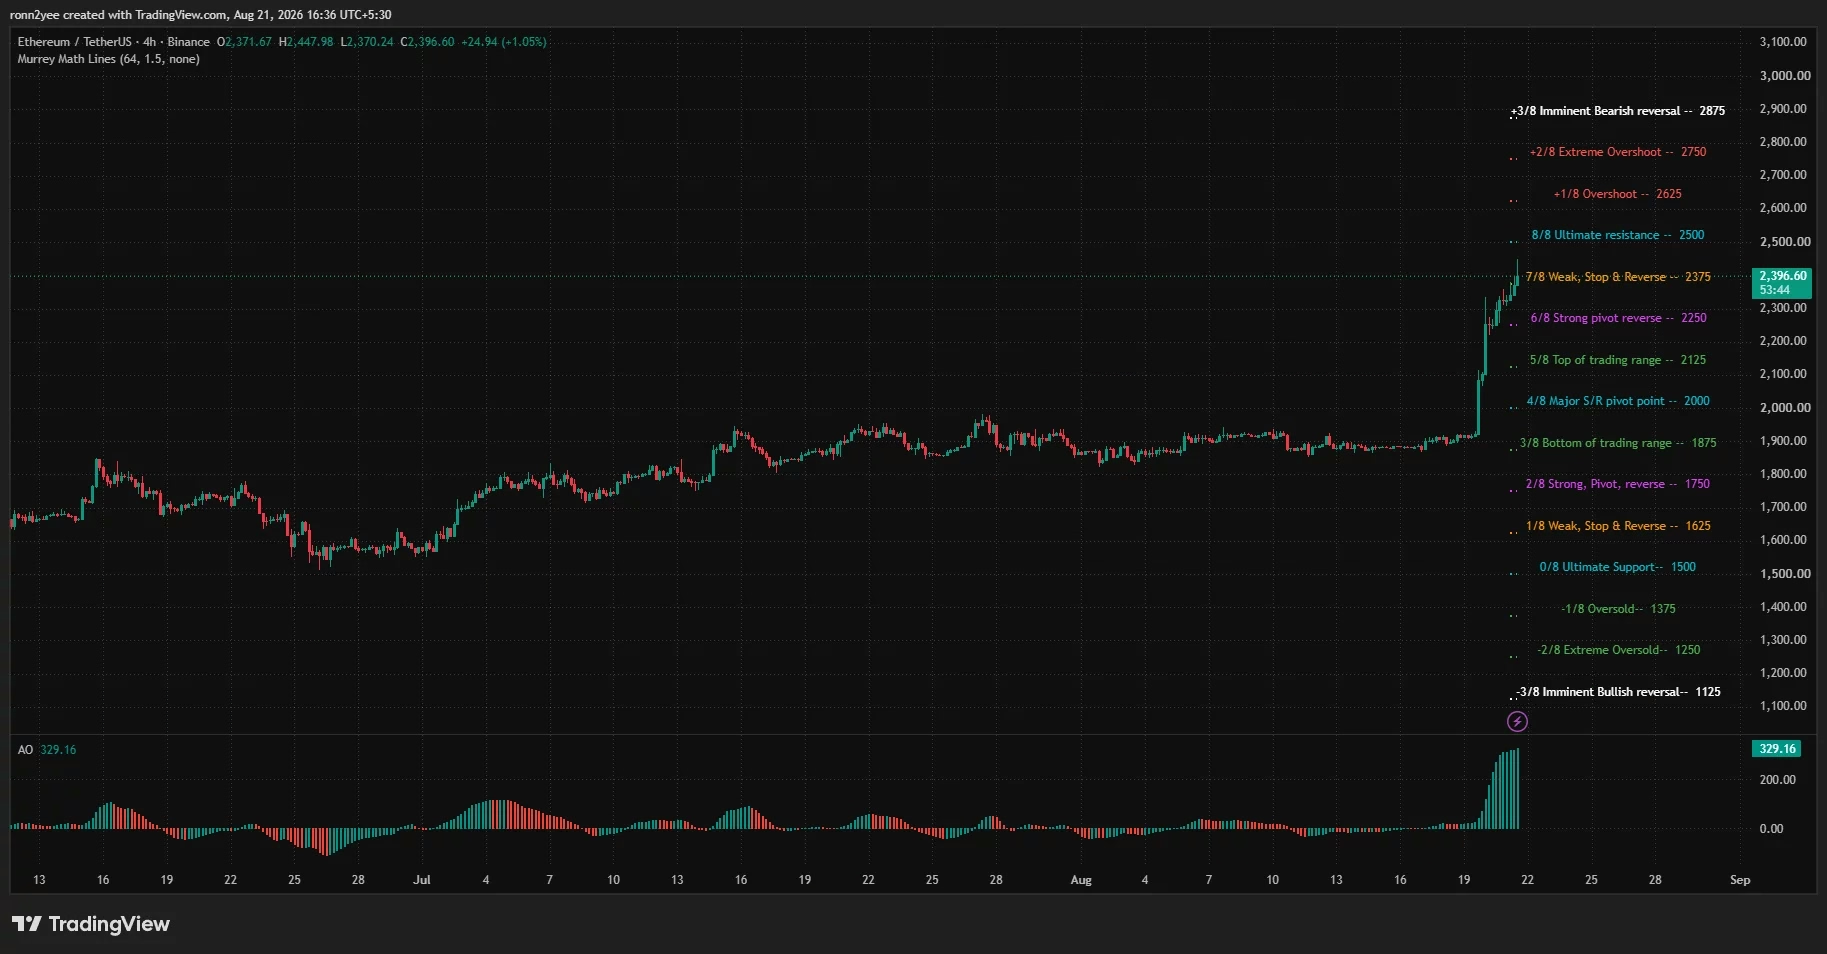
The breakout cleared the psychologically important $2,000 barrier and pushed through the $2,250 resistance area with surprising ease. On the 4-hour timeframe, Ethereum also surpassed the $2,375 Murrey Math level, though price action showed rejection near the intraday high of $2,448. The momentum indicators on shorter timeframes remained exceptionally strong, with the 4-hour Awesome Oscillator reaching 329.16 and displaying an expanding series of bullish signals.
The RSI Warning: When Overbought Becomes Dangerous ⚠️
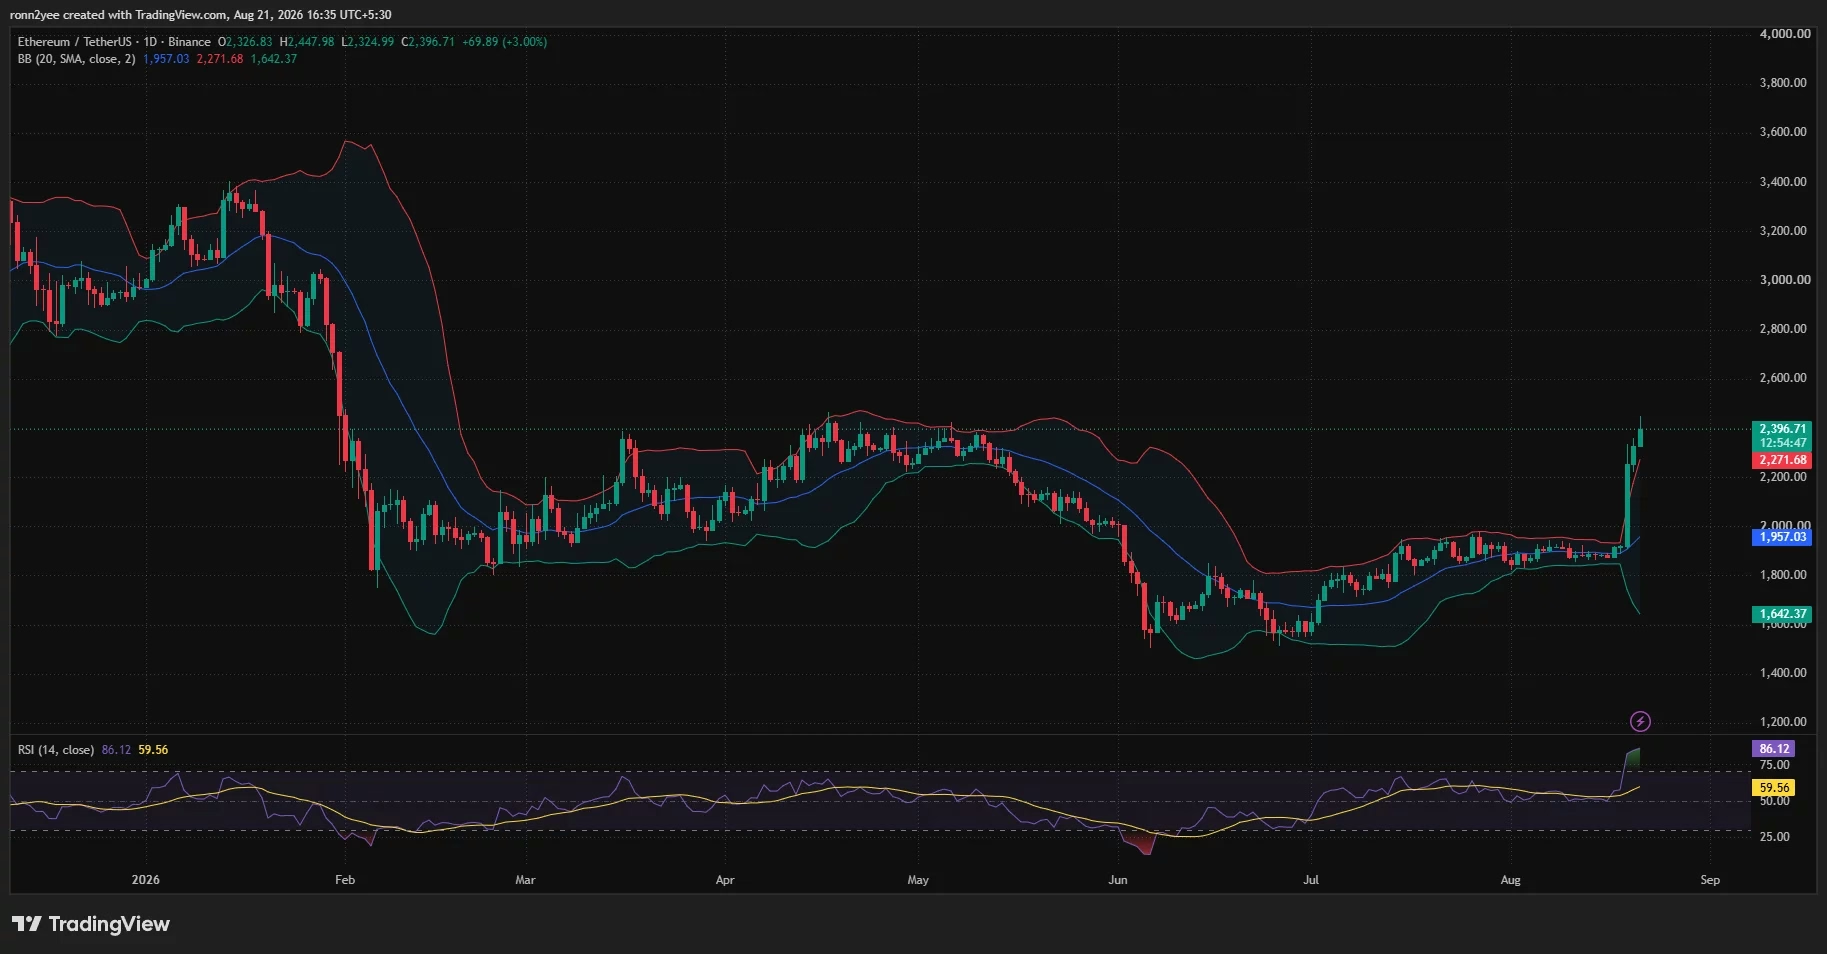
The most concerning technical development is Ethereum's daily RSI reading of 86.12—a level that sits far above the conventional 70 overbought threshold. This extreme reading doesn't necessarily predict an immediate reversal, but it does indicate that prices have advanced far more rapidly than their historical trend would suggest.
When RSI reaches these elevated levels, mean reversion becomes a statistical probability. The indicator essentially measures the magnitude of price changes relative to historical volatility. An RSI of 86 suggests that Ethereum has moved approximately 3-4 standard deviations above its recent average, creating conditions where profit-taking becomes increasingly likely.
Historically, assets with RSI readings above 80 experience pullbacks approximately 65-70% of the time within the following 5-10 trading days. While past performance doesn't guarantee future results, this pattern has held across multiple market cycles and asset classes.
What's Driving This Explosive Rally? 🔥
Three primary catalysts have combined to create this powerful upward movement:
ETF Inflows and Institutional Demand 💰
US spot Ethereum ETFs attracted $189 million in net inflows on August 19—their strongest daily intake since October 2025. BlackRock's ETHA fund alone accounted for approximately $122 million of this total. This institutional capital influx represents a significant shift in how traditional investors access Ethereum exposure, removing the friction of direct custody and exchange accounts.
Short Liquidation Cascade 📊
As Ethereum broke above $2,000, traders holding leveraged short positions faced forced liquidations. Data indicates that over $1 billion in Ether shorts were liquidated during this initial breakout, contributing to a broader crypto liquidation event that exceeded $3 billion. These forced purchases created a self-reinforcing cycle where liquidations triggered stop-losses, which triggered more liquidations.
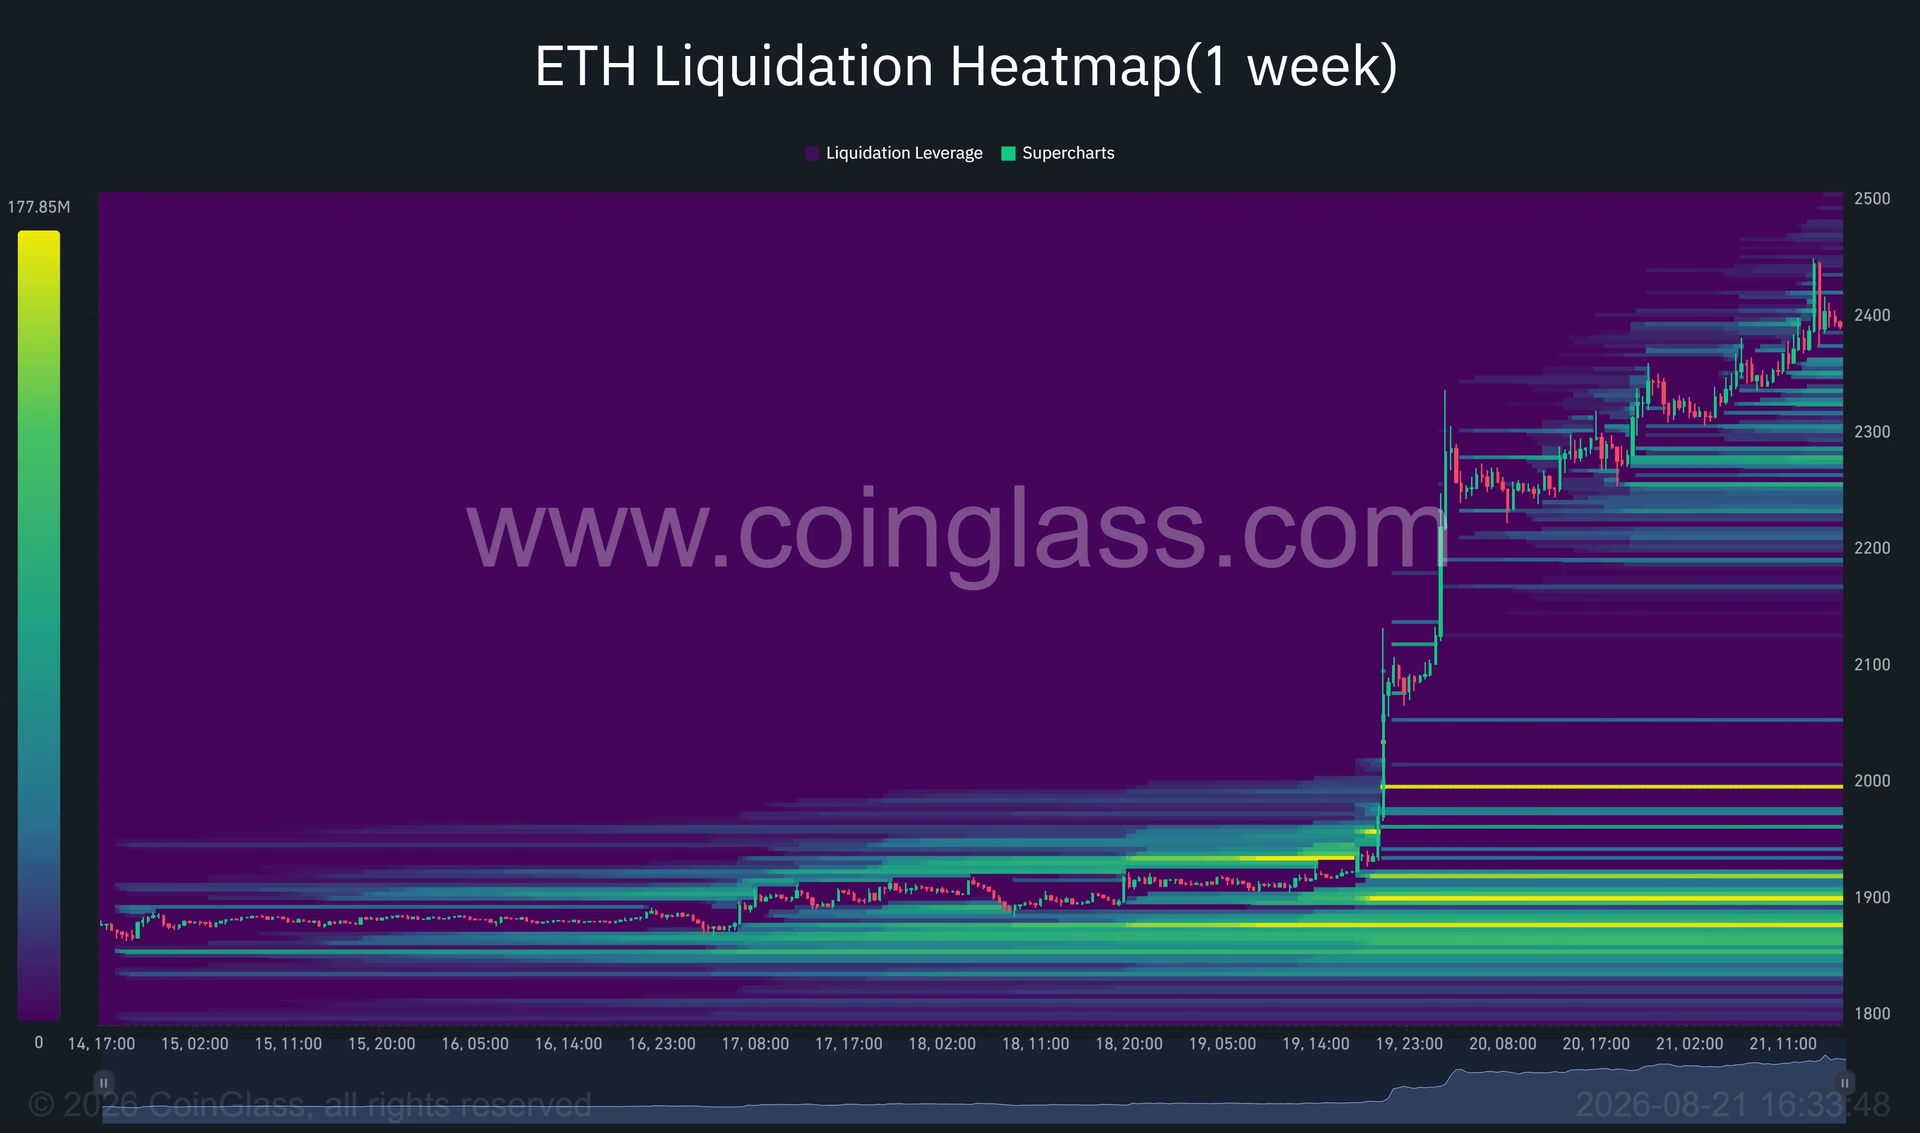
The liquidation heatmap reveals how ETH moved rapidly through liquidation clusters concentrated between $1,900 and $2,300. This layered structure of liquidations likely accelerated the advance beyond what organic demand alone would have produced.
Macroeconomic Tailwinds 🌍
The US Treasury's announcement to double the maximum size of buybacks for longer-dated nominal securities from $2 billion to $4 billion per operation provided a crucial macro catalyst. This change, effective September 9 through November 4, signaled support for bond-market liquidity. In response, Treasury yields and the US dollar weakened, creating favorable conditions for risk assets including Bitcoin and Ethereum.
Additionally, the SEC's Regulation Crypto Assets proposal published on August 18 introduced tailored registration exemptions for certain investment contracts involving crypto assets, including fundraising exemptions of up to $75 million annually. While this doesn't immediately change Ethereum's regulatory status, it signals an improving regulatory backdrop that could attract additional institutional capital.
Technical Resistance and Support Levels 🎯
Ethereum now faces critical technical decision points that will determine whether this rally continues or reverses:
Immediate Resistance Zones:
- $2,448-$2,500: The intraday high and next major Murrey Math resistance level
- $2,625: Secondary resistance if $2,500 is cleared
- $2,750: Tertiary resistance level
- $2,875: Stronger reversal risk zone
A sustained weekly close above $2,450 could expose the $2,500 and $3,000 levels, according to technical analysts monitoring the situation. However, achieving these levels would require continued institutional demand to absorb profit-taking.
Critical Support Levels:
- $2,375: Murrey Math support on the 4-hour chart
- $2,300-$2,250: Liquidation concentration zone
- $2,000: The breakout support and psychological barrier
- $1,957: Daily Bollinger Band midpoint
The Bollinger Band Divergence ⚡
Ethereum's price action relative to its daily Bollinger Bands presents another warning signal. ETH is trading approximately 5.5% above the upper Bollinger Band at $2,272, while the indicator's middle band remains near $1,957. This extreme divergence indicates that prices have extended well beyond normal trading ranges, creating what traders call "band squeeze" conditions.
When prices move this far above the upper band, mean reversion toward the middle band becomes statistically probable. The distance between current price and the middle band represents potential downside of approximately 18% if reversion occurs.
What Traders Should Watch 👀
The upcoming trading sessions will reveal whether Ethereum's rally represents a sustainable breakout or an overextended move destined for consolidation:
Bullish Confirmation Signals:
- Weekly close above $2,450
- Sustained volume supporting higher prices
- RSI declining from 86 while price holds above $2,300
- New institutional ETF inflows continuing
Bearish Warning Signs:
- Rejection below $2,450 on multiple attempts
- Volume declining as price rises
- RSI remaining above 80 for more than 3 consecutive days
- Liquidation heatmap concentrations between $2,270-$2,350 being tested
The Profit-Taking Risk 💡
Market participants holding positions from lower levels now face a critical decision. Ethereum has appreciated so rapidly that taking profits becomes increasingly attractive, especially given the overbought technical readings. If significant profit-taking occurs near $2,450, ETH could decline toward $2,375 or $2,300 as the daily RSI resets from its extreme levels.
A deeper reversal could test the $2,000 support level, though this would require a breakdown in the new market structure established during the breakout. The $1,957 Bollinger Band midpoint and the dense liquidation heatmap cluster around $1,990 would provide additional support above the $2,000 psychological level.
The Regulatory Backdrop Matters 📋
While technical factors dominate short-term price action, the improving regulatory environment provides fundamental support for Ethereum's longer-term trajectory. The SEC's proposed framework suggests policymakers are moving toward clearer pathways for crypto asset regulation rather than outright prohibition.
This regulatory clarity could prove transformative for institutional adoption. Traditional finance firms have expressed hesitance about Ethereum exposure partly due to regulatory uncertainty. As that uncertainty diminishes, institutional capital that's currently sitting on the sidelines could accelerate inflows into spot ETFs and direct holdings.
Looking Forward: Key Levels to Monitor 🔮
The next 5-10 trading days will be crucial for determining whether Ethereum's breakout becomes the beginning of a sustained bull market or merely an overextended spike. Analysts watching the situation have identified $2,450 as the critical level to monitor for a weekly close confirmation.
If Ethereum can establish support above $2,000 while consolidating recent gains, it would preserve the new market structure and suggest that institutional demand proved more significant than liquidation-driven volatility. Conversely, a failure to hold $2,000 would indicate that the rally was primarily technical in nature and lacked fundamental buying support.
Conclusion: Risk-Reward at an Inflection Point 🎬
Ethereum's surge to $2,448 represents one of the most dramatic moves in recent memory, driven by converging forces of institutional ETF demand, short liquidations, and improving macroeconomic conditions. However, the daily RSI at 86 and price trading 5.5% above the upper Bollinger Band create genuine pullback risks that traders cannot ignore.
The coming days will reveal whether this breakout can sustain itself or whether profit-taking and mean reversion take hold. For longer-term investors, the improving regulatory environment and institutional adoption trends remain supportive. For active traders, the overbought technical readings demand careful risk management and realistic profit-taking targets.
The $2,450 level represents the critical decision point—a weekly close above this level would validate the breakout and open the path toward $2,500 and beyond. A rejection would suggest consolidation or pullback is more likely. Either way, Ethereum's recent action has reset market structure and created new dynamics that will influence price action for months to come. 📊✨
You May Also Like

Market Analysis
Bitcoin Breaks $76K: ETF Inflows Drive Institutional Rally
August 21, 2026

Market Analysis
The $3 Billion Short Squeeze: Crypto's Biggest Liquidation Since 2021
August 21, 2026

Market Analysis
Core Scientific's $24B AI Comeback Faces Debt Test
August 21, 2026

Market Analysis
Bitcoin Surges 11% Above $71,000: Market Drivers Explained
August 21, 2026