Category:
Market AnalysisEthereum Price Clears Key Averages in Push Toward $2,000

Ethereum has captured significant momentum as it trades decisively above critical technical levels, signaling renewed strength in the world's leading smart contract platform. 📈 The second-largest cryptocurrency by market capitalization is consolidating gains and positioning itself for a potential breakout toward the psychologically important $2,000 milestone—a level that hasn't been tested since earlier this year.
Ethereum Breaks Through Moving Averages 🚀
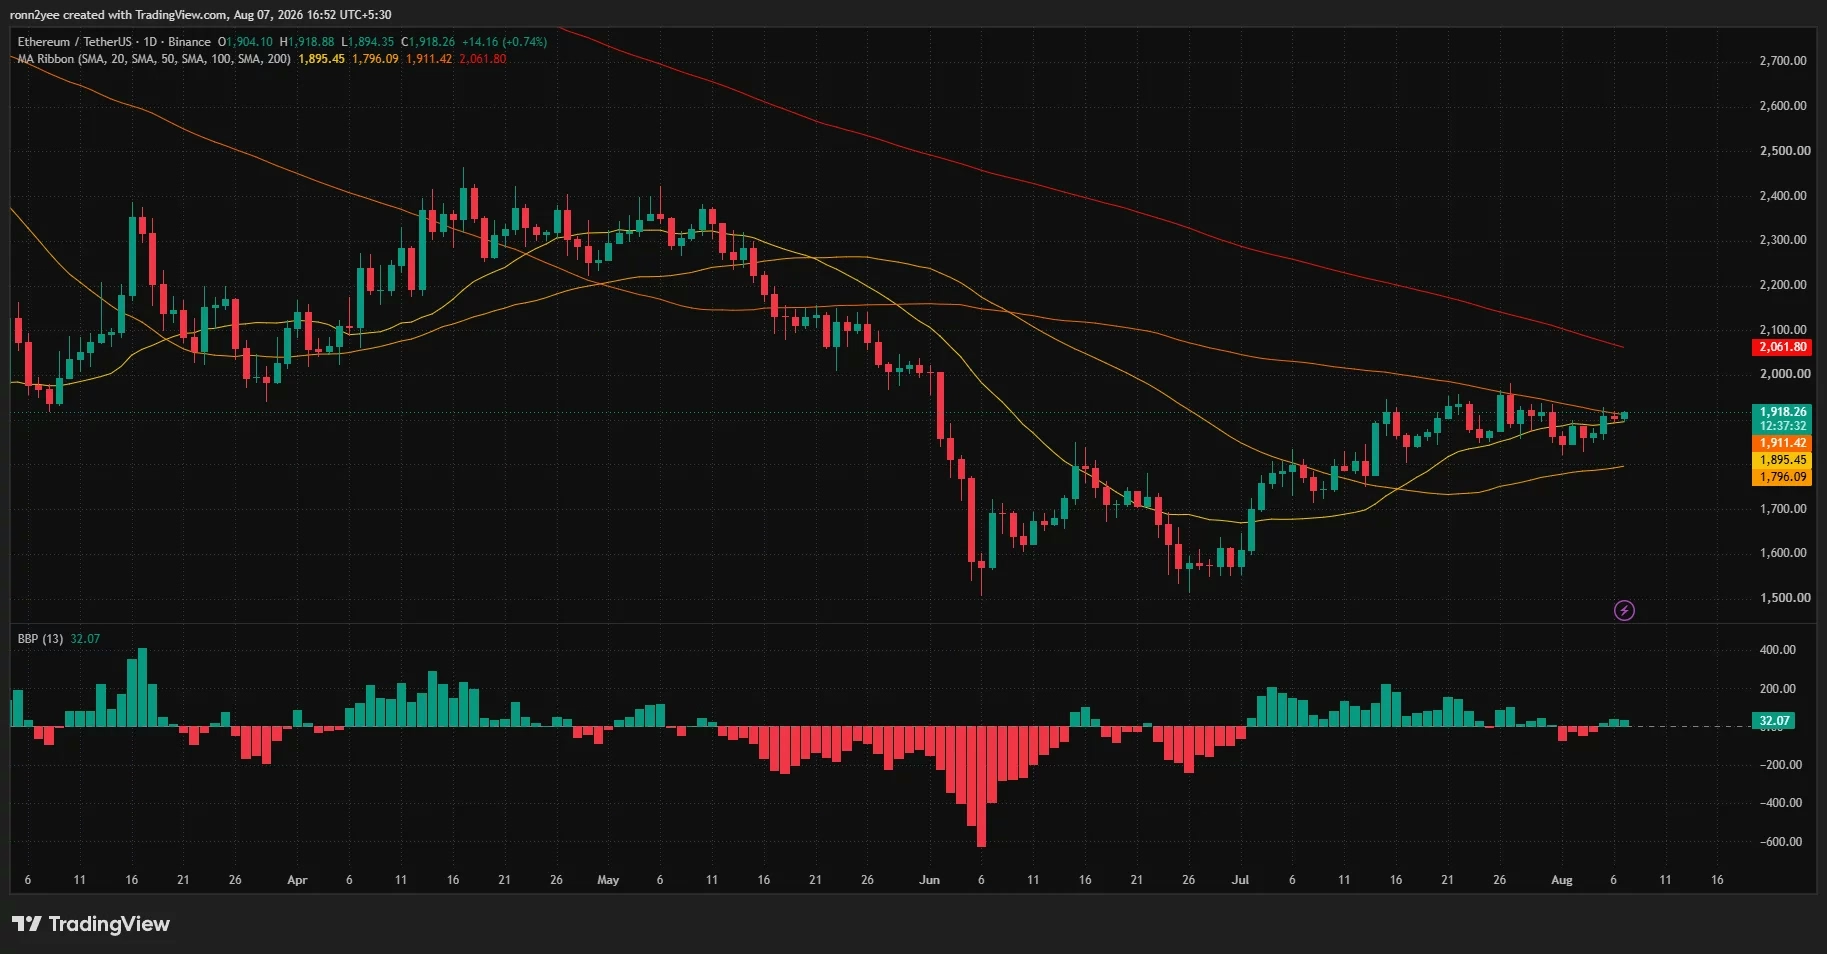
The recent price action represents a meaningful technical achievement for ETH holders and traders. Ethereum has successfully cleared three important daily moving averages that typically serve as dynamic support and resistance levels. The token now trades above its 20-day moving average at $1,895.45, its 50-day average at $1,796.09, and its 100-day average at $1,911.42.
This alignment of moving averages creates what technical analysts call a "bullish stack," where shorter-term averages sit above longer-term ones. Such configurations historically suggest positive momentum and can attract momentum-based traders seeking to ride the wave higher. However, Ethereum remains below its 200-day moving average at $2,061.80, indicating that while the short-term trend has improved, the broader longer-term downtrend from April's highs above $2,400 has not yet reversed.
ETF Inflows Fuel Institutional Demand 💰
One of the most compelling catalysts supporting Ethereum's recent strength comes from institutional-grade investment vehicles. US spot Ethereum exchange-traded funds recorded approximately $92.15 million in net inflows on August 6th alone—equivalent to roughly 48,327 ETH at prevailing market prices. This follows strong inflows of $60.86 million just the previous day, with BlackRock's flagship ETHA product contributing $50.34 million of that figure.
These figures underscore the growing appetite among traditional investors to gain regulated Ethereum exposure through conventional brokerage accounts. The cumulative net inflows into US spot Ethereum ETFs have now surpassed $11.4 billion since their inception, representing a substantial shift in how institutional capital accesses digital assets. While ETF flows don't always produce immediate proportional price movements, the consistent inflow pattern suggests sustained institutional confidence in Ethereum's long-term prospects.
The availability of these regulated investment vehicles has democratized access to Ethereum for millions of investors who previously faced regulatory or operational barriers. This structural development could have profound implications for Ethereum's price discovery mechanism and volatility profile over coming years.
Technical Indicators Flash Bullish Signals ⚡
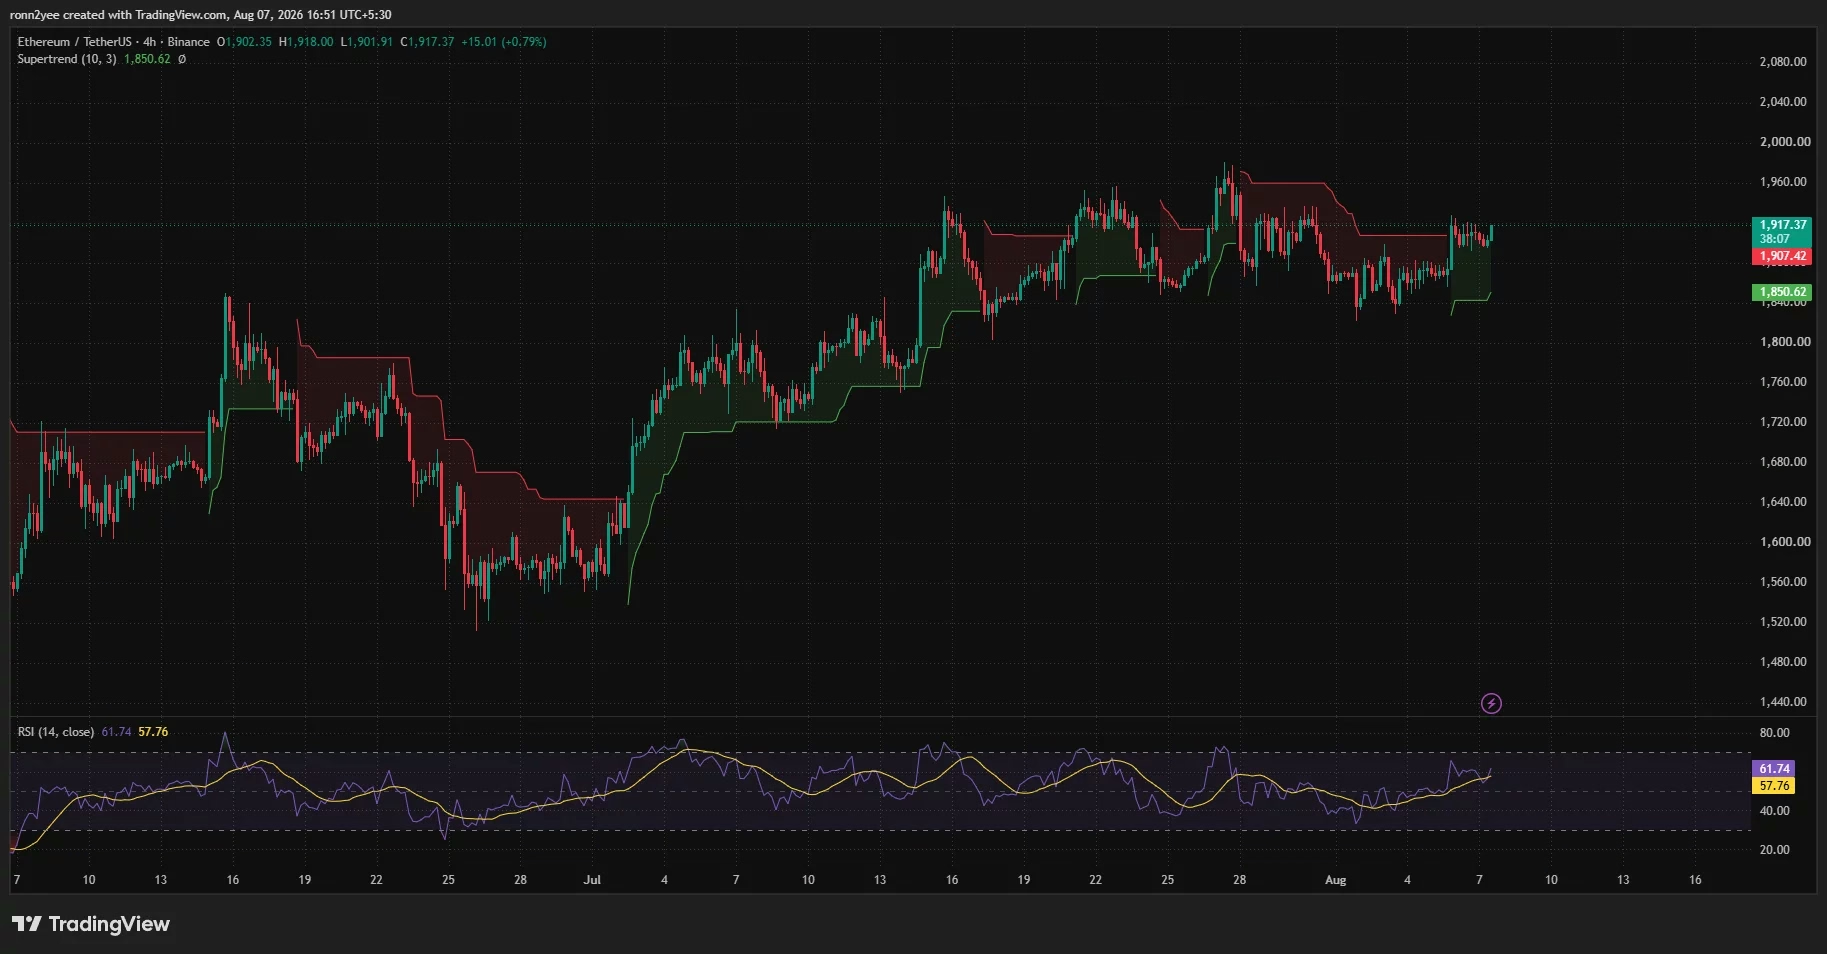
The short-term technical picture for Ethereum has shifted decidedly constructive. The 4-hour Relative Strength Index (RSI) recently climbed to 61.74, sitting comfortably above its signal average of 57.76. This reading indicates genuine bullish momentum without yet entering overbought territory—the critical 70 level that often precedes pullbacks or consolidations.
The daily Bull Bear Power indicator has returned to positive territory at 32.07, suggesting that buyers have regained a meaningful advantage after bearish pressure briefly emerged at the start of August. This metric, which measures the strength of buyers relative to sellers, provides valuable insight into the balance of power between market participants.
Moreover, Ethereum's price has moved above the Supertrend threshold on the 4-hour chart near $1,907.42. Maintaining this level would preserve the immediate bullish structure and provide buyers with another opportunity to test recent resistance highs. The Supertrend indicator, favored by many professional traders, helps identify trend direction and potential reversal points with reasonable accuracy.
Liquidation Clusters Point to $1,950 Target 🎯
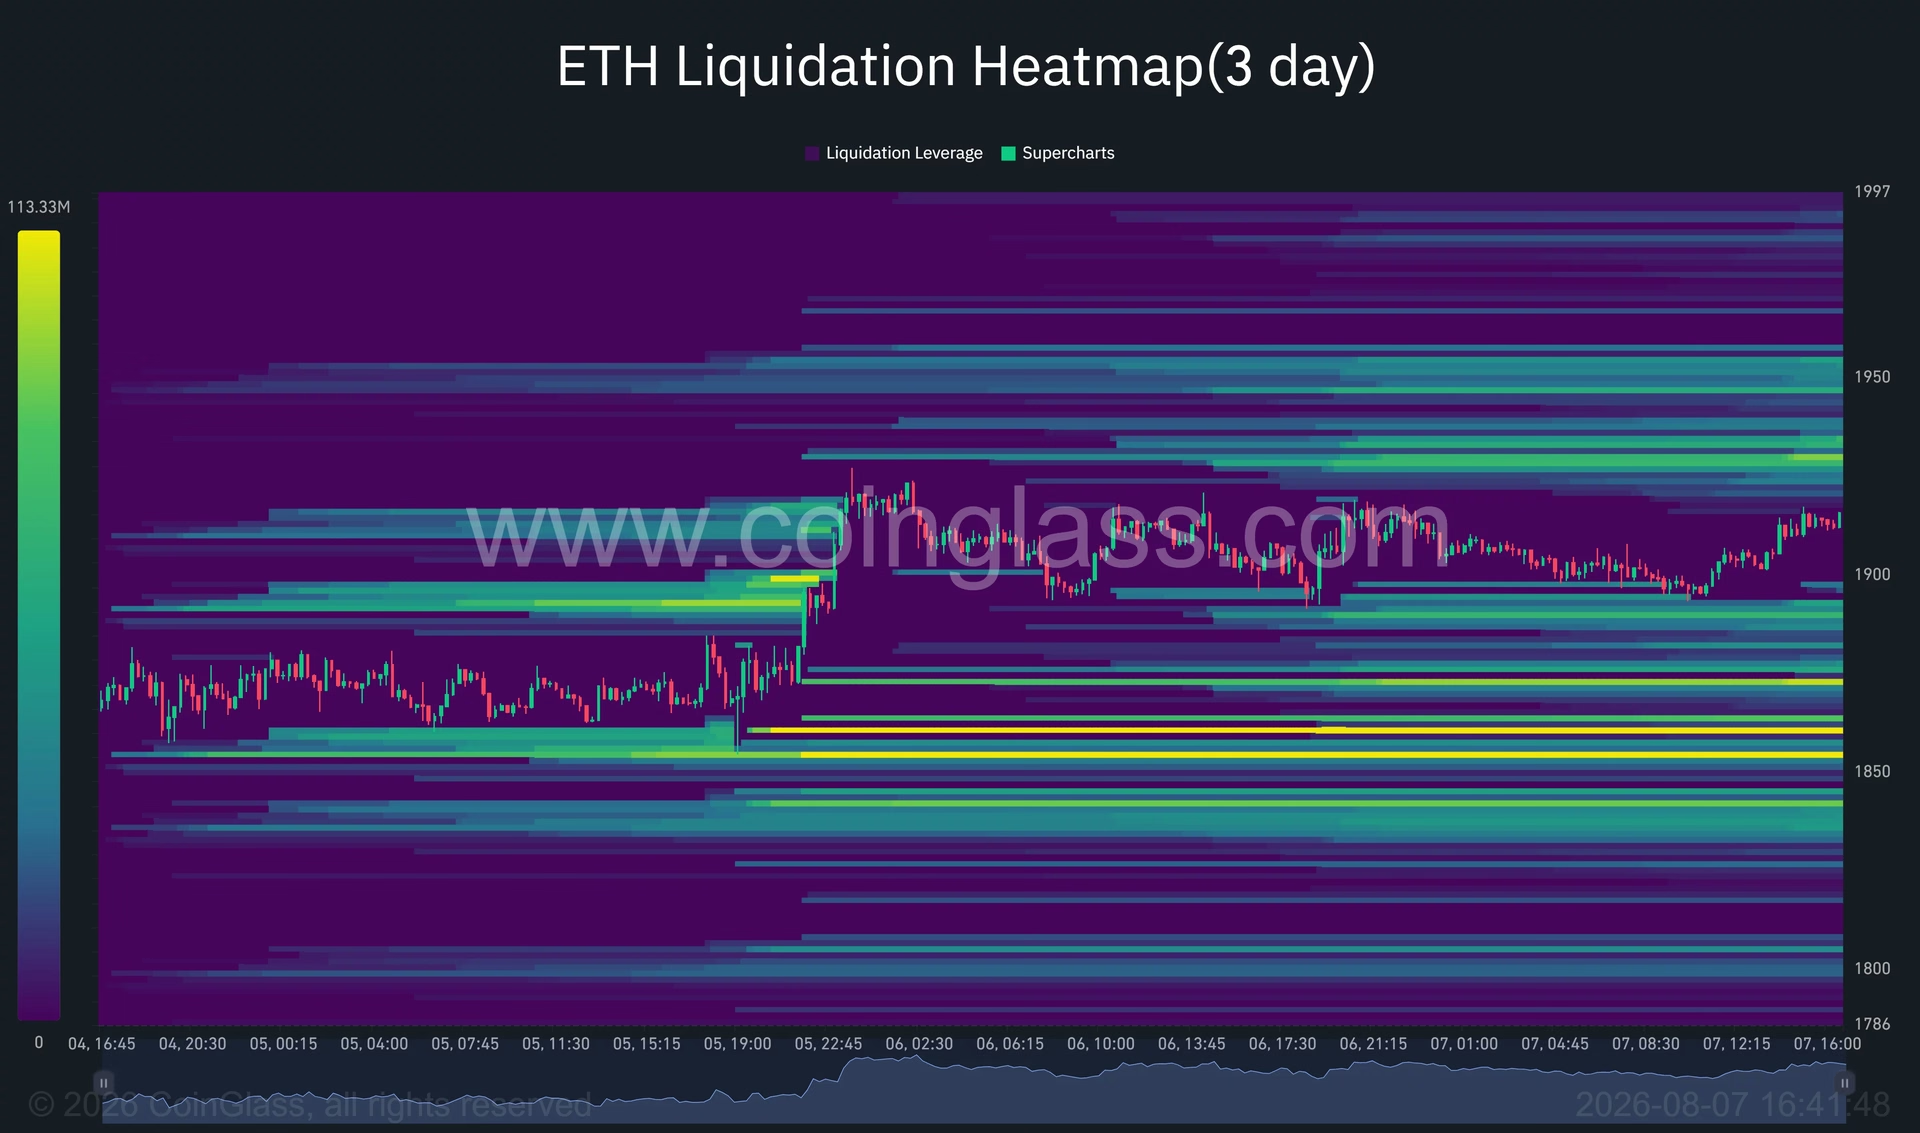
The 3-day liquidation heatmap reveals crucial information about where leveraged traders have positioned themselves. A significant concentration of liquidation orders exists immediately above current price levels near $1,925, with an even larger liquidity band clustered around $1,945–$1,955. These liquidation zones function as price magnets—when price approaches these levels, the forced unwinding of leveraged positions can accelerate price movement.
Breaking through $1,925 could trigger cascading liquidations of short positions, potentially propelling Ethereum toward the $1,950 level with considerable momentum. Such technical setups, where price is attracted to areas of concentrated liquidity, represent some of the most reliable short-term trading opportunities in cryptocurrency markets.
The Path to $2,000 and Beyond 📊
Analysts tracking Ethereum's technical structure increasingly point to $2,000 as the immediate near-term objective. Respected technical analyst Michaël van de Poppe has suggested that Ethereum could significantly outperform Bitcoin if the market leader initiates another major upward move. His analysis places a broader Ethereum target near $2,400, though he emphasizes that ETH must first overcome resistance around $2,000 and the crucial 200-day moving average near $2,062.
Another prominent analyst, Ted Pillows, has highlighted the significance of Ethereum holding above the $1,900 psychological level. "If ETH manages to hold above this level, a rally to $2,000 could happen next," he noted. The $1,900 mark has emerged as the critical dividing line between bullish and bearish short-term scenarios—a daily close above $1,925 would substantially strengthen the case for $1,950 and $2,000, while any reversal below $1,900 would redirect attention back toward $1,850.
Support Levels Provide Safety Net 🛡️
For traders and investors concerned about downside risk, multiple support zones exist below current prices. Ethereum has found repeated buyer interest in the $1,840–$1,850 region since early August, with buyers consistently defending this zone against deeper corrections. The 4-hour Supertrend support near $1,850.62 provides the main bullish invalidation level—a sustained break below this point would weaken the recovery thesis and potentially open a move toward $1,800 or the 50-day average near $1,796.
Additional liquidity bands have formed around $1,890 and $1,870, providing intermediate support levels should price consolidate or pull back. The presence of these multiple support zones suggests that any correction would likely be contained within a defined range rather than collapsing into a free fall.
Macroeconomic Backdrop Supports Risk Assets 🌍
Beyond purely technical factors, the broader macroeconomic environment has shifted in ways favorable to risk assets like Ethereum. Recent US employment data showed private employers added only 44,000 jobs in July, falling short of forecasts around 70,000 and declining from a revised 95,000 in June. This softer hiring figure points to cooling in the labor market, potentially reducing the likelihood of aggressive Federal Reserve rate hikes in coming months.
However, the employment picture remains nuanced. Annual pay growth still rose 4.4%, and jobless claims remained historically low, leaving uncertainty around the Fed's next policy decision. Any renewed increase in rate-hike expectations could weigh on Ethereum and other risk assets, as higher interest rates typically reduce the appeal of speculative investments.
Key Takeaways for Ethereum Traders 💡
Ethereum's recent price action has established several important technical milestones that warrant close monitoring:
- Bullish alignment: ETH now trades above its 20-day, 50-day, and 100-day moving averages, creating a favorable technical structure for continued upside
- Institutional support: Sustained ETF inflows totaling over $11.4 billion cumulatively demonstrate growing institutional adoption
- Momentum confirmation: RSI at 61.74 and positive Bull Bear Power readings indicate genuine buyer strength without excessive overbought conditions
- Liquidation targets: The $1,925–$1,950 zone represents a natural price magnet where forced liquidations could accelerate momentum
- Psychological resistance: The $2,000 level remains the next significant test, with the 200-day average at $2,062 representing the broader trend-turning point
The path forward for Ethereum depends critically on whether bulls can maintain control above $1,900 and push through the concentrated resistance near $1,925. A daily close above $1,925 would substantially increase the probability of testing $1,950 and eventually $2,000. Conversely, any reversal below $1,900 would shift focus back to support levels and potentially extend the consolidation phase.
For long-term Ethereum investors, the current environment presents an encouraging technical setup supported by genuine institutional demand through ETF vehicles. However, traders should remain cognizant of macroeconomic risks, particularly around Federal Reserve policy decisions that could rapidly shift sentiment toward risk assets. The next few trading sessions will likely prove decisive in determining whether Ethereum can definitively break toward $2,000 or consolidate further before attempting another advance. 🎢
You May Also Like

Market Analysis
XRP Price Falls 5% as Leverage Hits Seven-Month High
August 26, 2026

Market Analysis
Crypto Market Hits Extreme Greed: What This Means for Bitcoin
August 26, 2026

Market Analysis
Ethereum Price Rally Overheats Below $2,550 Resistance
August 26, 2026

Market Analysis
Hyperliquid Price Rally: HYPE Targets $97 Amid $80 Support
August 25, 2026