Category:
Market AnalysisEthereum Price Drops 2.6%: Will $1,850 Support Hold?

Ethereum is facing critical technical pressure as the leading smart contract platform experiences a notable pullback in the current market cycle. 📉 The second-largest cryptocurrency by market capitalization has declined 2.6% toward the $1,870 level, triggering widespread liquidations and forcing traders to reassess their near-term outlook. With multiple technical indicators flashing warning signs and key support levels under scrutiny, the crypto community is closely monitoring whether ETH can maintain its footing or face deeper losses.
The Recent Price Action: Breaking Below Key Resistance ⚠️
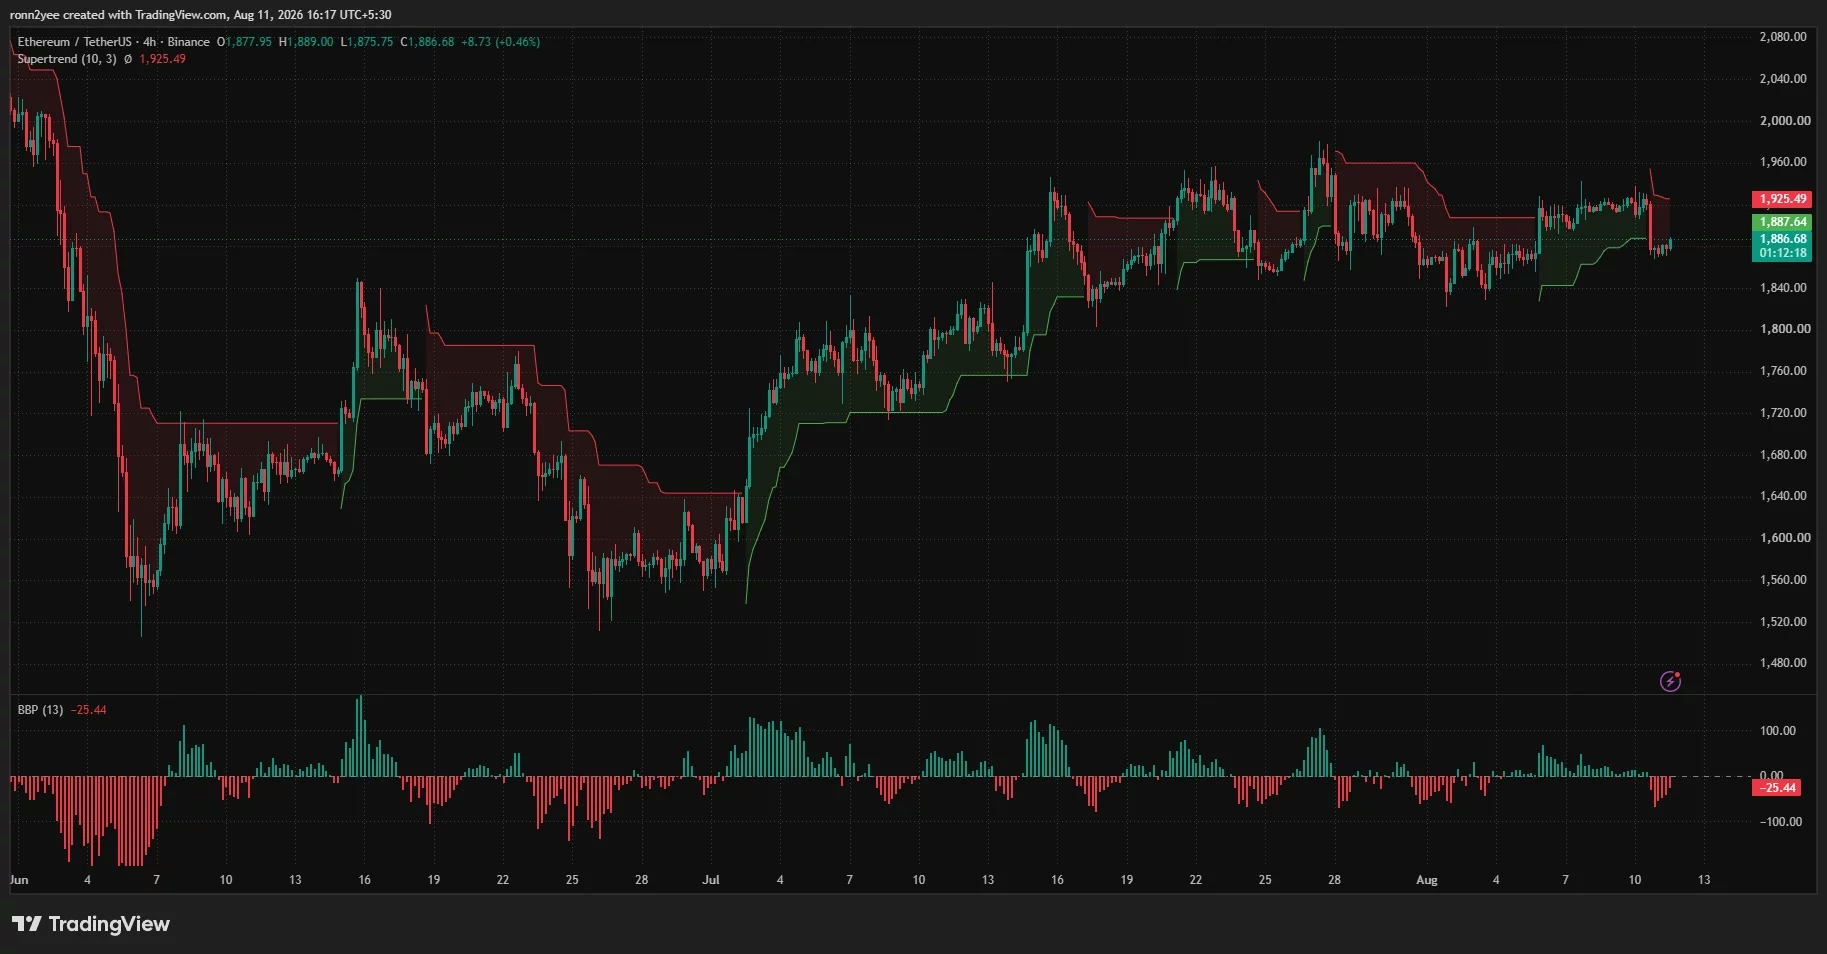
Ethereum's recent decline represents another failed attempt to establish momentum above the psychologically significant $1,900 level. Over the past several trading sessions, ETH has been consolidating within a relatively tight range, oscillating between approximately $1,850 and $1,950. This compression phase has created a volatile environment where directional clarity remains elusive.
The rejection below $1,950 proved particularly damaging, as it exposed overleveraged long positions that traders had established in anticipation of a breakout move. When buyers failed to sustain prices above $1,900, a cascade of liquidations ensued, amplifying the downward pressure and pushing ETH toward intraday lows near $1,867. By the time the latest technical snapshots were captured, the token had recovered modestly to around $1,886, though this rebound remained insufficient to reclaim the critical $1,900 threshold.
This pattern of rejection is significant because it demonstrates that institutional and retail buyers lack sufficient conviction to drive a sustained rally through established resistance zones. The repeated failure at the same price level signals weakening momentum and suggests that sellers maintain control of the short-term price discovery process.
Understanding the Technical Breakdown 📊
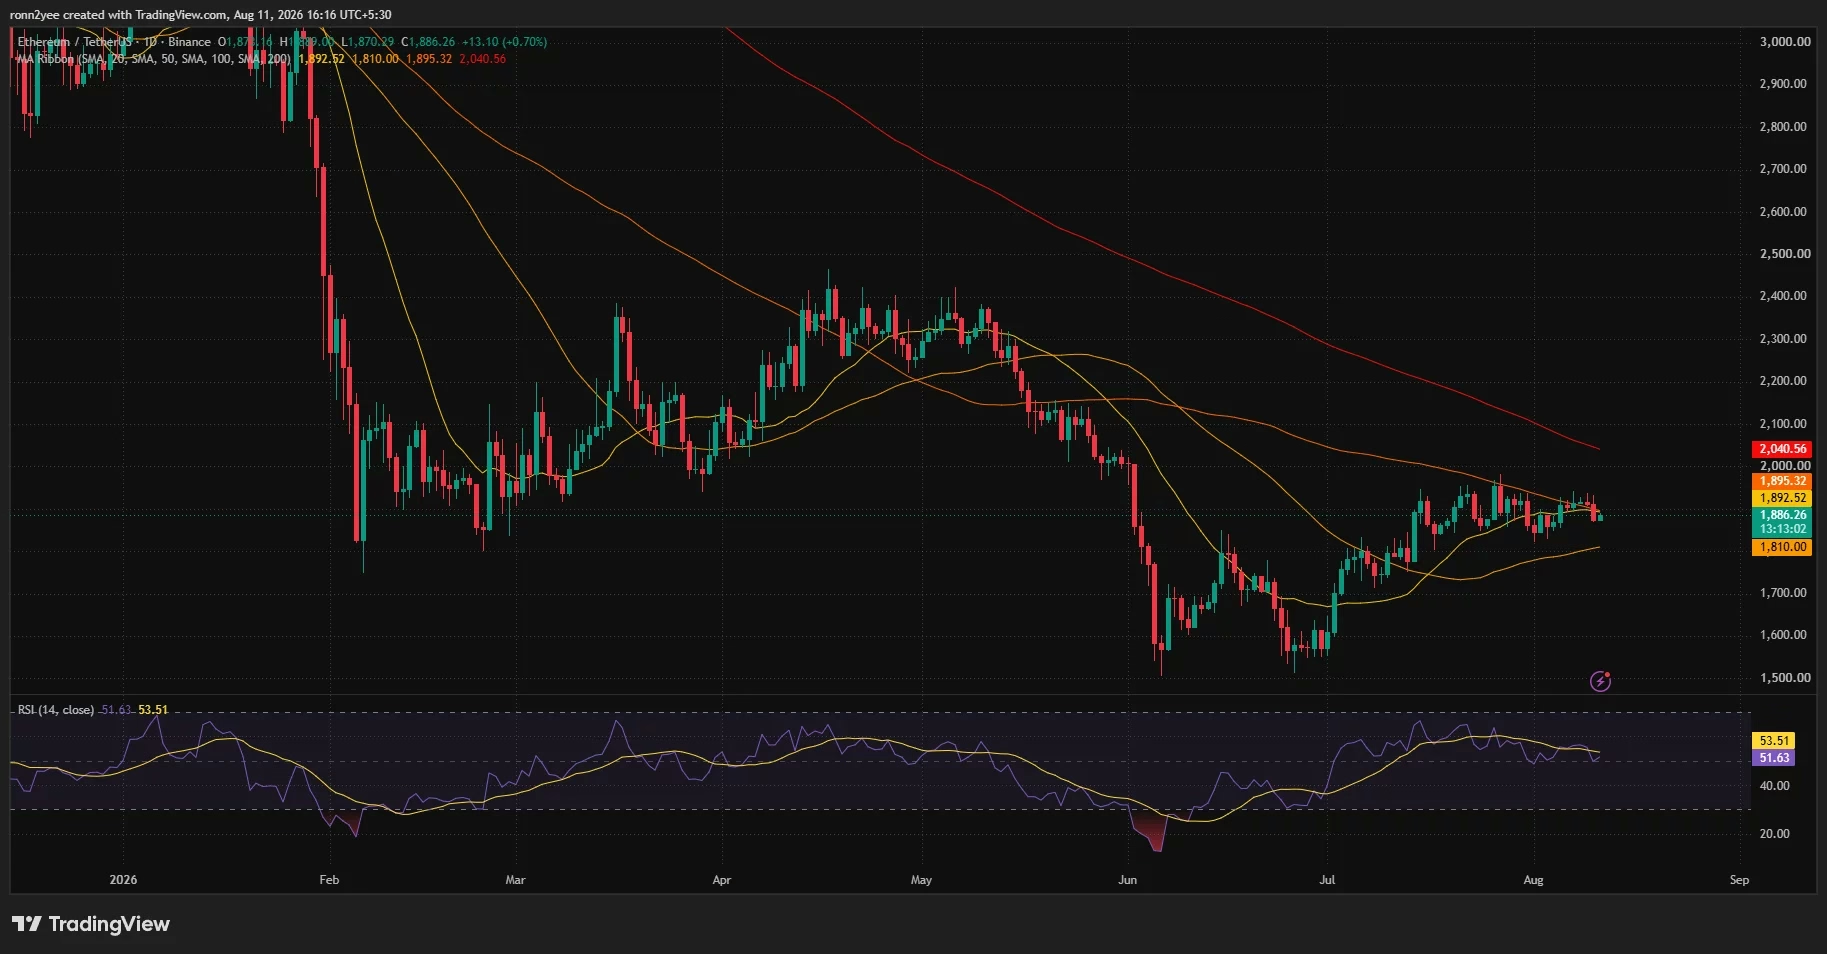
From a technical perspective, Ethereum's current setup presents several concerning signals that justify the cautious sentiment among traders. The daily Relative Strength Index (RSI) stands at 51.63, indicating a neutral reading that sits slightly below the signal average of 53.51. While this suggests that oversold conditions have not yet materialized, it also confirms that sellers have regained short-term control of price action.
More troubling is Ethereum's position relative to its major moving averages. The token is currently trading below its 20-day simple moving average at $1,892.52 and its 100-day average at $1,895.32, creating a zone of resistance around $1,890–$1,900 that has consistently contained rallies since late July. The 200-day SMA at $2,040.56 remains significantly higher, representing a longer-term resistance level that would only become relevant if ETH first breaks through the $1,950 zone and establishes support above $2,000.
The 4-hour timeframe reveals additional weakness through the Bull Bear Power indicator, which has declined to -25.44. This negative reading demonstrates that selling pressure has intensified as Ethereum approached the $1,930 level, confirming that buying momentum has weakened substantially. Additionally, the 4-hour Supertrend has flipped bearish, placing dynamic resistance at approximately $1,925—a level that ETH must reclaim before the indicator would support another advance toward $1,950.
Critical Support and Resistance Zones 🎯
Analysts have identified several crucial price levels that will determine Ethereum's next directional move. The $1,850 support zone represents what many in the community refer to as the "bullish invalidation level." Should ETH decisively break below this area, it would confirm a shift toward a more bearish intermediate-term outlook and could trigger an acceleration toward $1,700 and eventually the $1,550 region—levels that would represent approximately 15-20% additional losses from current prices.
Conversely, the $1,950 level serves as the breakout threshold that bulls must conquer to establish a more convincing recovery narrative. Breaking and holding above this resistance would open the door to moves toward $2,000 and potentially $2,190, representing gains of 8-18% from current levels. However, the repeated rejections at this exact zone suggest that significant selling pressure exists, and bulls have struggled to generate sufficient momentum to overcome determined sellers.
Liquidation Dynamics: The Hidden Price Driver 💥
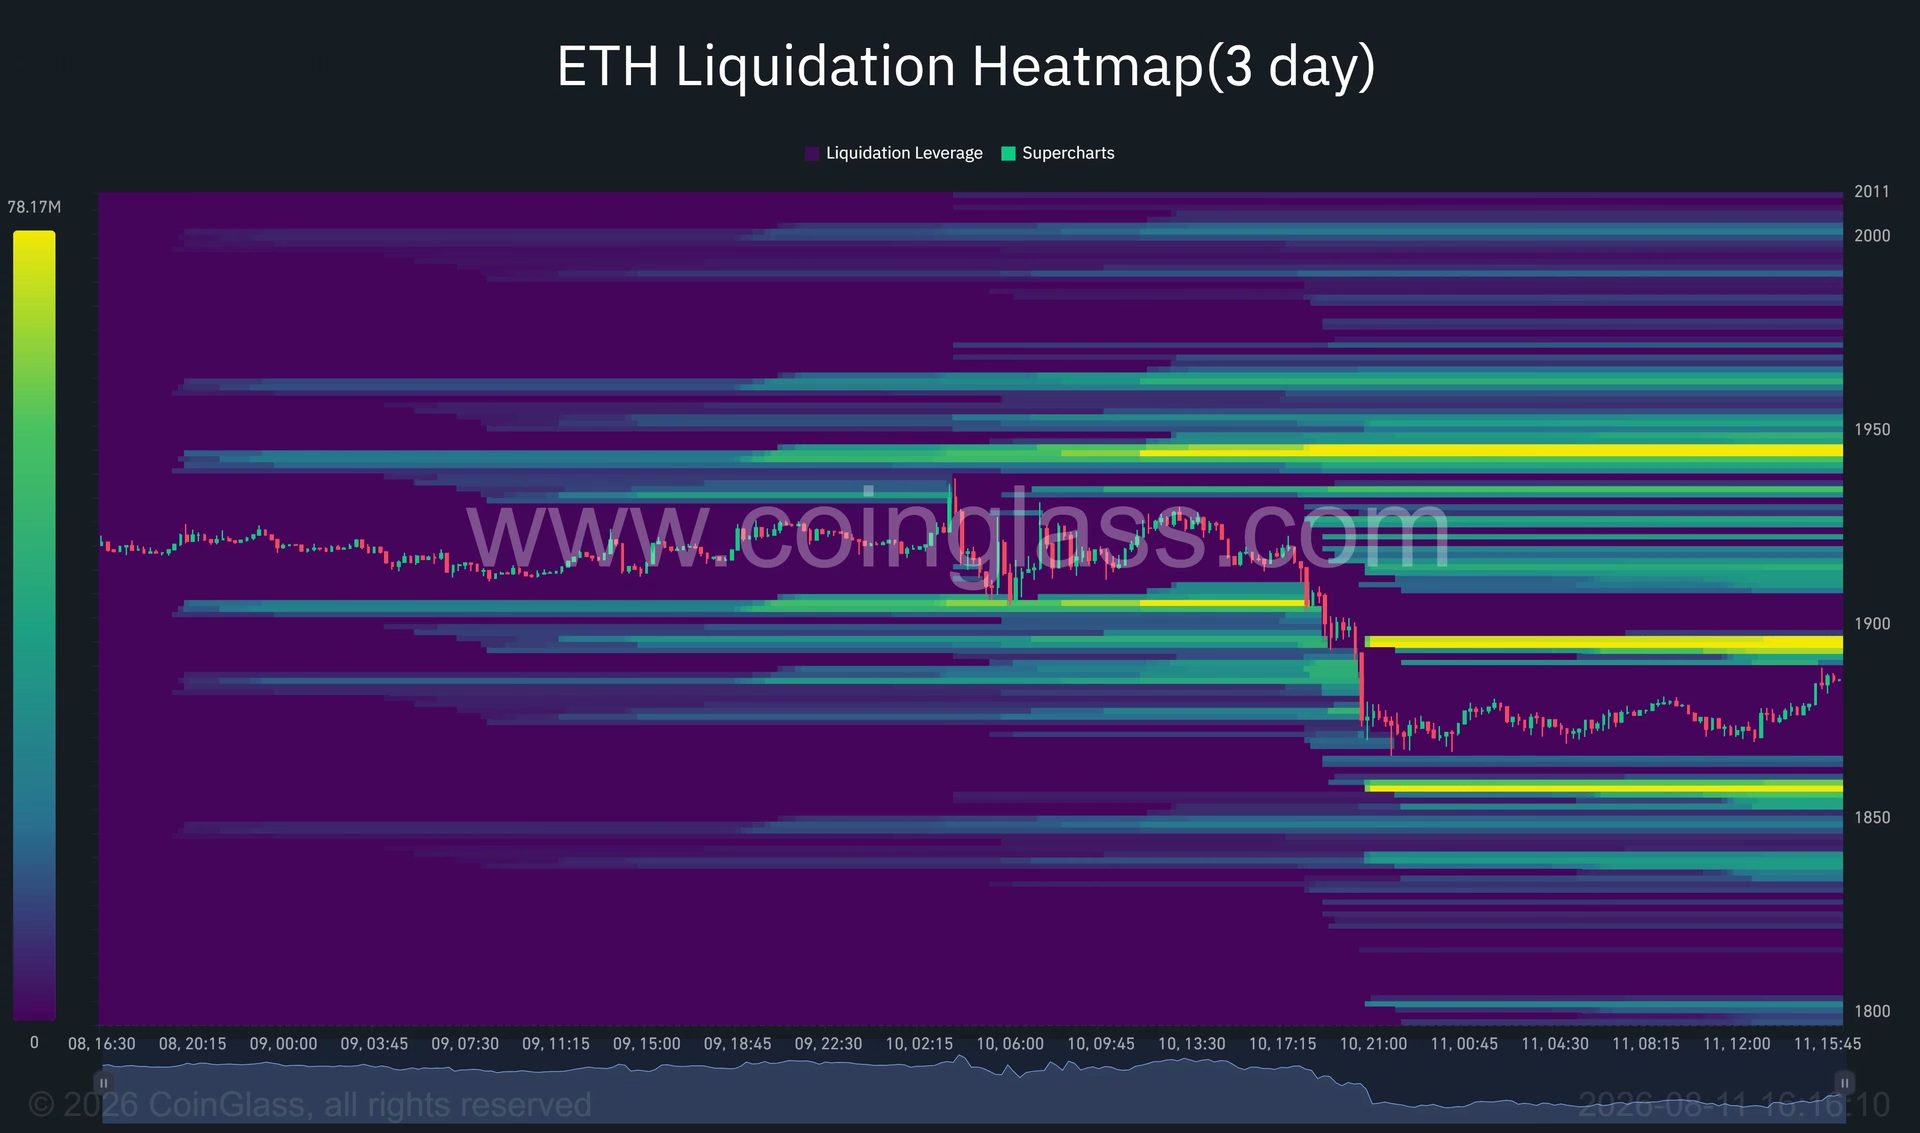
The CoinGlass liquidation heatmap reveals a critical insight into how price action might unfold in the coming sessions. A dense concentration of leveraged positions exists near $1,895, representing the closest major upside liquidity pool above Ethereum's current trading range. Should ETH's recovery continue and price move through this level, nearby short positions would be liquidated, potentially triggering forced buying that could accelerate a return above $1,900.
This forced liquidation cascade could expose smaller liquidity bands between approximately $1,915 and $1,930, creating stepping stones toward higher resistance. The strongest overhead concentration of leverage appears near $1,940, which sits directly within the same resistance zone that has stopped Ethereum's recent advances. This overlap of technical resistance and leveraged long positions makes $1,940 a particularly significant level—a potential short-squeeze target that could attract aggressive buyers if price approaches it.
On the downside, liquidity is concentrated around $1,857, just below the critical $1,850 support level. A decline into this area would likely trigger another wave of long liquidations before buyers attempt to defend the broader $1,840–$1,850 support zone. This structure creates a classic liquidity trap scenario where a break on either side could produce sharper moves as exchanges close positions caught offside.
Macroeconomic Headwinds and Market Sentiment 🌍
Beyond technical factors, Ethereum's current weakness must be understood within the broader context of macroeconomic uncertainty and shifting risk sentiment. Traders have been reducing risk exposure ahead of the latest U.S. Consumer Price Index report, scheduled for August 12 at 8:30 a.m. Eastern Time. This inflation data represents a critical catalyst for cryptocurrency markets, as it will significantly influence Federal Reserve policy expectations and broader financial market sentiment.
A hotter-than-expected inflation reading would likely support a higher-for-longer Federal Reserve policy outlook, pressuring speculative assets like Ethereum and potentially driving prices lower. Conversely, softer inflation data could improve liquidity expectations and provide the tailwind that ETH needs to challenge its overhead resistance. The uncertainty surrounding this data release has prompted many traders to reduce leverage and tighten stop-loss orders, contributing to the recent selling pressure.
Additionally, rising energy prices have introduced further uncertainty into the macroeconomic outlook. Higher oil costs can feed into headline inflation and complicate expectations for future U.S. interest-rate decisions. Although the direct effect on Ethereum's price will ultimately depend on the CPI result and the market's immediate response, the broader inflationary environment creates a headwind for risk assets in the near term.
What Traders Are Watching 👀
Several prominent cryptocurrency analysts have offered their perspectives on Ethereum's current technical setup. Analyst Ted Pillows has identified $1,850 as a must-hold area if Ethereum is to produce another convincing push above $1,900 and eventually toward $2,000 and $2,190. His analysis suggests that a confirmed loss of the $1,850 support could open a decline toward $1,700 and eventually the $1,550 region—a scenario that would represent a significant breakdown from current levels.
Daan Crypto Trades has offered a similar range assessment, arguing that ETH must break and hold $1,950 to open a move above $2,100. This perspective aligns with the broader consensus that the $1,950 zone represents a critical inflection point for the intermediate-term trend. Until Ethereum can establish a daily close above this level, the technical setup remains tilted toward caution.
The Broader Recovery Context 📈
It's important to recognize that despite the recent weakness, Ethereum remains in a wider recovery from its late-June low near $1,520. The token has successfully established a sequence of higher lows, demonstrating that buyers have been willing to defend support levels during pullbacks. However, the lack of a decisive higher high above the July peak near $1,970 means the market has not yet produced a confirmed breakout, leaving traders uncertain about whether the recovery will continue or whether the June low represents a temporary bounce within a larger downtrend.
This ambiguity is precisely why technical levels like $1,850 and $1,950 have become so critical. They represent the boundaries of the trading range that will determine whether Ethereum can escape its consolidation phase and establish a new intermediate-term uptrend, or whether the recovery has stalled and further downside is imminent.
Key Takeaways and What's Ahead 🚀
Ethereum's 2.6% decline and the test of critical support levels represent a pivotal moment for the cryptocurrency. The $1,850 support zone must hold if bulls are to maintain their intermediate-term thesis, while a break above $1,950 is required to open the door to higher prices. Liquidation dynamics and macroeconomic uncertainty will likely play significant roles in determining which scenario unfolds.
Traders should monitor the upcoming U.S. inflation report closely, as this data release could provide the catalyst needed to break the current consolidation pattern. In the meantime, risk management remains paramount—the technical setup suggests that volatility could increase substantially once price breaks decisively in either direction. Whether Ethereum can defend $1,850 and mount a recovery toward $1,950 will depend on the interplay between technical support, liquidation dynamics, and the broader macroeconomic environment. 💡
You May Also Like

Market Analysis
XRP Price Falls 5% as Leverage Hits Seven-Month High
August 26, 2026

Market Analysis
Crypto Market Hits Extreme Greed: What This Means for Bitcoin
August 26, 2026

Market Analysis
Ethereum Price Rally Overheats Below $2,550 Resistance
August 26, 2026

Market Analysis
Hyperliquid Price Rally: HYPE Targets $97 Amid $80 Support
August 25, 2026