Category:
Market AnalysisEthereum Price Eyes $2,500 as RSI Flashes Warning

Ethereum has captured significant attention in recent weeks as the second-largest cryptocurrency by market capitalization surges toward critical resistance levels. 🚀 The recent price action tells a compelling story of momentum, technical extremes, and the complex interplay between market sentiment and technical indicators that define modern cryptocurrency trading.
The Ethereum Breakout: A 20% Rally in Hours ⚡
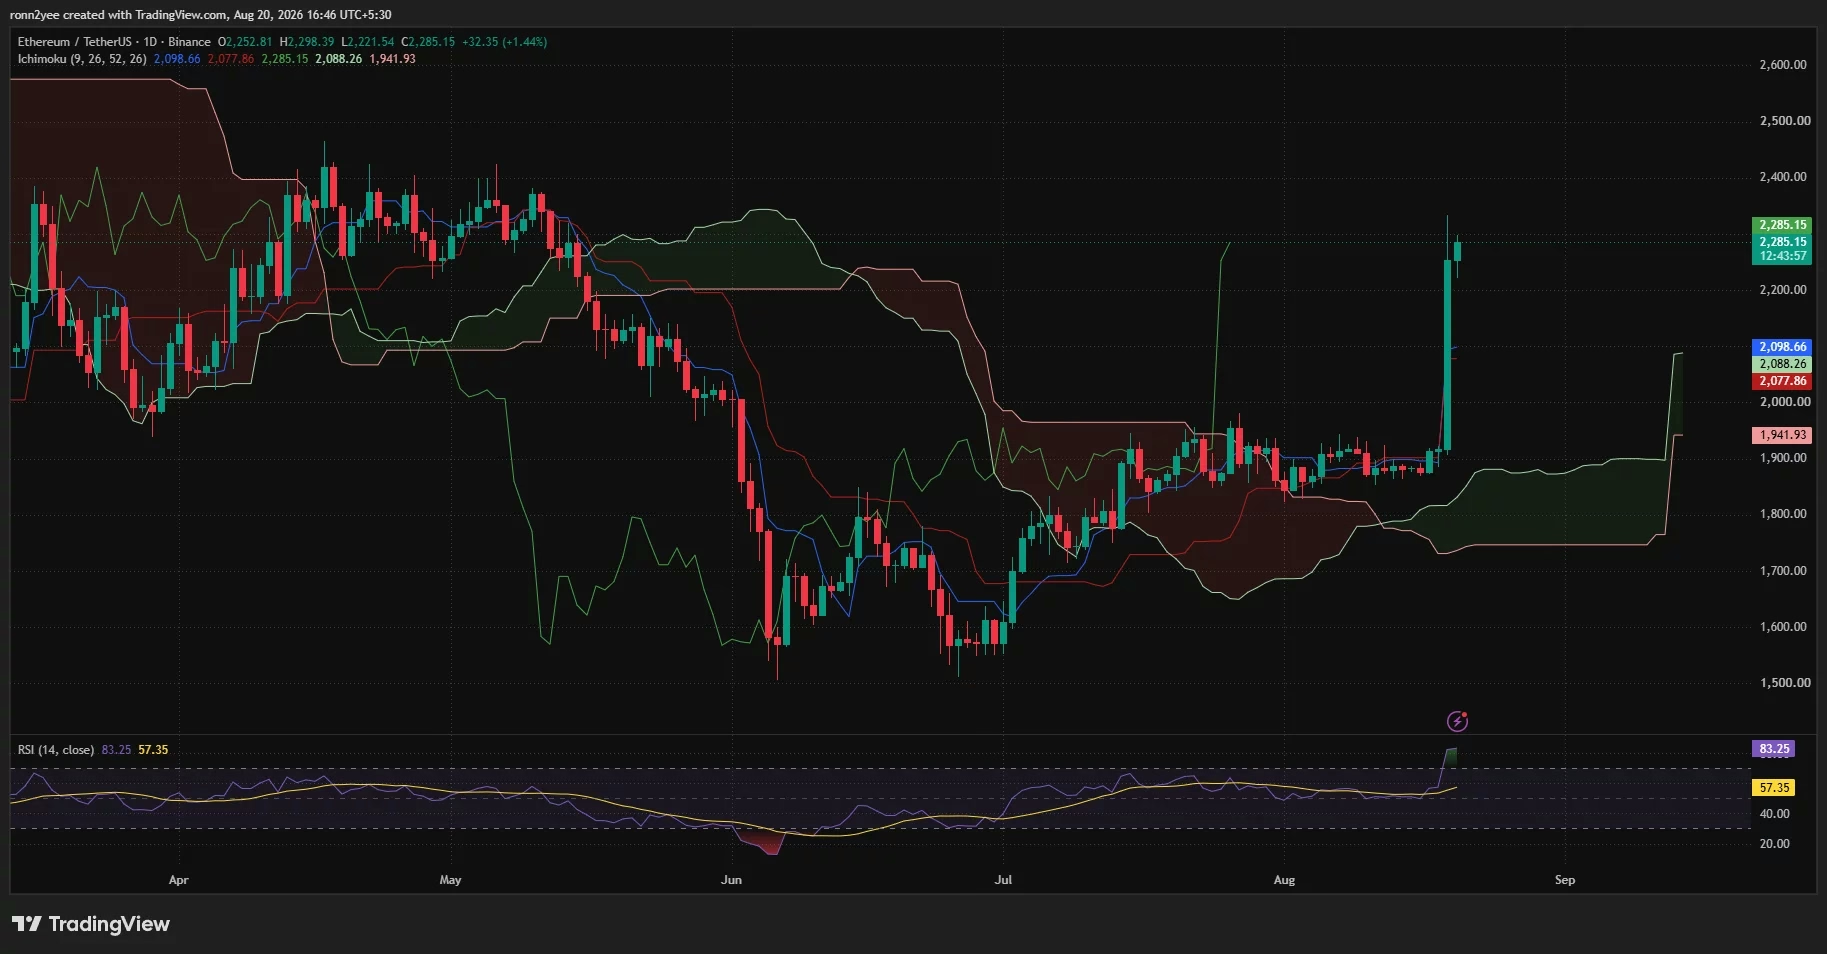
Ethereum's recent performance has been nothing short of dramatic. After spending most of August consolidating between $1,850 and $1,950, ETH experienced a powerful breakout that pushed the asset from below $1,950 to an intraday high near $2,300 in a matter of hours. This represents approximately a 20% gain—a move that left many traders scrambling to adjust their positions and reposition their portfolios.
The rally was particularly noteworthy because it shattered multiple resistance levels with minimal sustained pauses. Traders who had built short positions around the psychological $2,000 level found themselves forced to cover their bearish bets as prices accelerated upward. At press time on August 20, Ethereum traded near $2,285, up 1.4% on the daily candle after briefly touching $2,298.
What Triggered the Ethereum Rally? 🎯
The timing of this breakout provides important context for understanding the broader market dynamics at play. The surge coincided with a wider cryptocurrency rally that followed announcements regarding U.S. Treasury operations. On August 19, the Treasury announced it would increase the maximum size of liquidity-support buybacks for 10-to-30-year Treasury securities from $2 billion to at least $4 billion per operation, effective September 9 through November 4.
While the Treasury program itself targets bond market liquidity rather than cryptocurrency markets directly, market participants interpreted the announcement as supportive of financial liquidity and risk assets more broadly. This interpretation helped fuel a broader rally across risk-sensitive assets, including digital currencies.
Key catalysts driving Ethereum higher included:
- Improved macroeconomic sentiment following Treasury liquidity announcements
- Massive derivatives buying pressure, including $2.55 billion in taker buy volume during a single hour
- Significant short liquidations totaling approximately $49 million from a single highly-ranked trader
- Positive flows into U.S. spot Ethereum ETFs, which recorded $189.1 million in daily net inflows on August 19
- Growing regulatory optimism following political developments supporting digital asset market structure legislation
The derivatives component deserves particular attention. When traders holding short positions are forced to liquidate, exchanges automatically purchase the underlying asset to close their positions. This automatic buying mechanism can dramatically accelerate rallies, especially in volatile markets where leverage is prevalent.
Technical Warning Signs: The RSI Overbought Signal 📊
While the rally has captured headlines, technical analysts have begun raising caution flags about the speed and magnitude of Ethereum's advance. The daily relative strength index (RSI) has climbed to 83.25—well above the conventional overbought threshold of 70 and significantly elevated compared to its moving average near 57.
An RSI reading above 80 indicates that an asset has risen much faster than its recent average, suggesting that consolidation or even pullback risk may be building. However, it's crucial to understand that an overbought RSI doesn't guarantee an immediate decline, particularly during a strong breakout when momentum can remain elevated for extended periods.
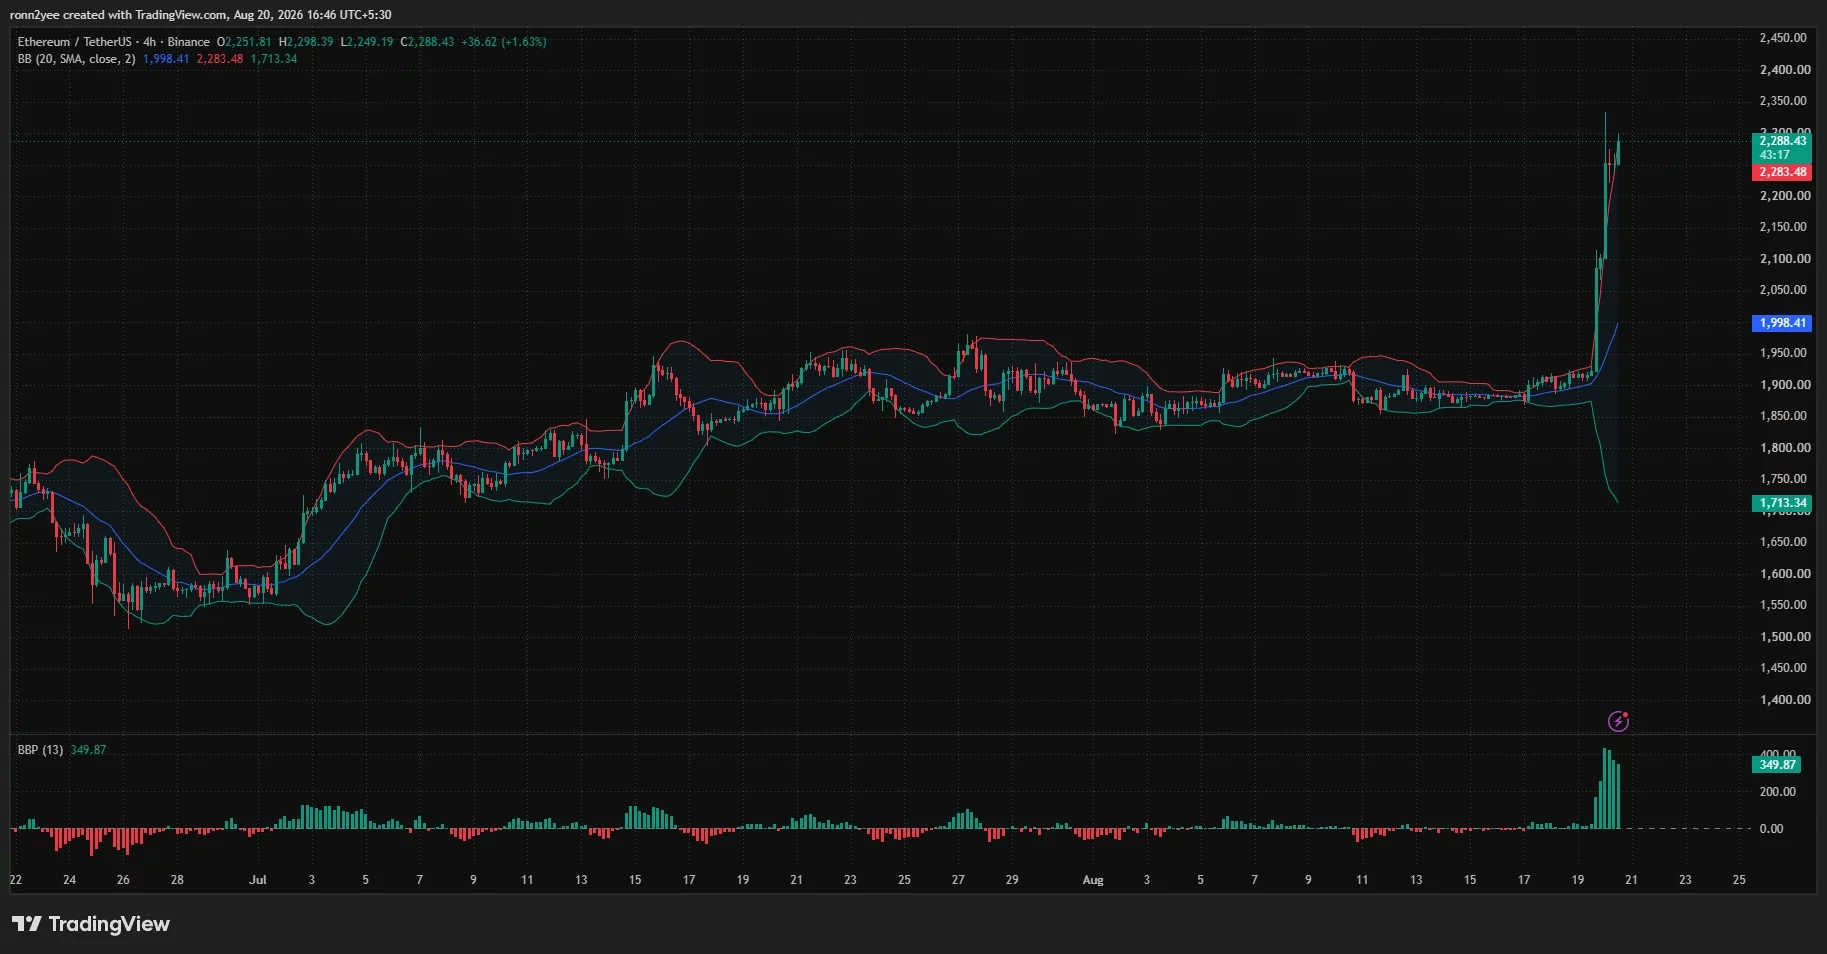
The 4-hour Bollinger Bands paint a similar picture of stretched momentum. Ethereum traded near $2,288, slightly above the upper Bollinger Band at approximately $2,283, while the middle band remained near $1,998. This wide distance between the current price and the middle band demonstrates how far Ethereum has moved from its recent mean, reinforcing the view that the market has entered an extended rally phase.
Ethereum Price Targets: The Path to $2,500 🎲
Despite the overbought signals, technical analysis suggests that Ethereum has clear pathways to higher levels. A daily close above $2,300 would open the door toward $2,400 and subsequently $2,500. The $2,500 level carries particular significance because it aligns with longer-term moving averages and a previous supply region visible on the weekly chart.
For Ethereum to reach these targets, the asset must navigate several intermediate resistance zones:
Resistance Levels (Ascending Order):
- $2,300–$2,350 (current immediate resistance with liquidation clusters)
- $2,400 (intermediate resistance level)
- $2,500 (major resistance zone with historical significance)
The Ichimoku cloud analysis provides additional perspective on Ethereum's technical structure. ETH has broken clearly above the cloud, trading approximately 9% above the Tenkan-sen at $2,098 and 10% above the Kijun-sen near $2,078. This positioning reflects the strength of the current breakout.
Liquidation Risk: A Double-Edged Sword 💥
The liquidation landscape presents an interesting paradox for Ethereum traders. CoinGlass data reveals a concentration of leveraged positions between $2,300 and $2,350—precisely at Ethereum's current price level. This clustering creates volatility risk in the near term.
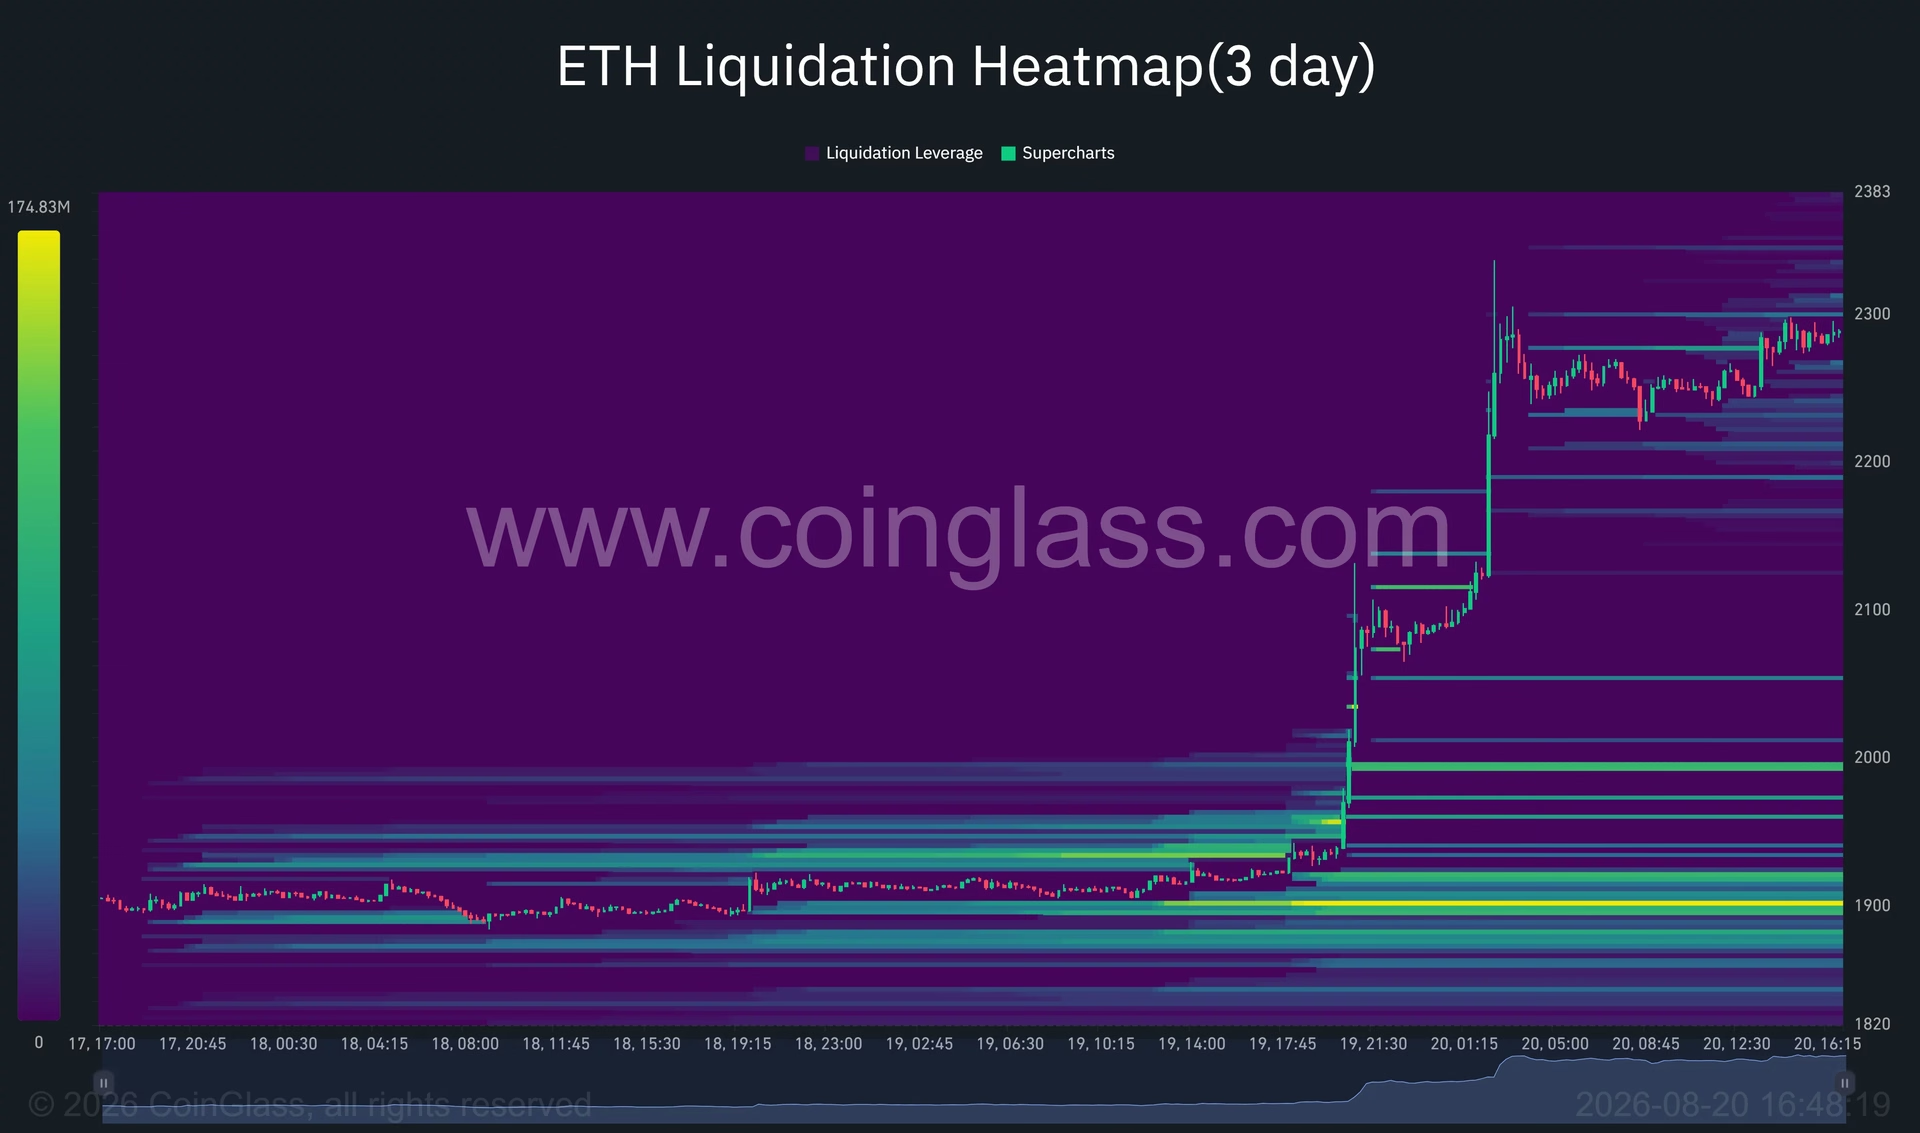
If Ethereum price moves into this zone, additional short liquidations could trigger further buying pressure, potentially providing fuel for another brief extension higher. However, this same dynamic also means that if prices fail to hold above $2,300, liquidations of long positions could accelerate a decline.
Support levels are more substantial and spread across a wider range:
- $2,220–$2,250: Nearest support where buyers repeatedly entered during consolidation
- $2,100: Secondary support near the Ichimoku cloud upper boundary
- $1,950–$2,000: Former range ceiling that broke down during the initial rally
- $1,900: Largest liquidation cluster at lower levels
The Broader Context: Regulatory Tailwinds and Market Sentiment 🌍
Beyond technical factors and derivatives positioning, Ethereum's rally has benefited from improving regulatory sentiment. President Donald Trump recently called on Congress to advance federal digital asset market structure legislation following a White House event attended by cryptocurrency industry executives. Additionally, the Securities and Exchange Commission has proposed a framework covering certain registered cryptocurrency asset offerings.
While neither development represents a completed change to federal law, both signal potential progress on the regulatory front—a factor that historically has supported cryptocurrency valuations. The combination of improved regulatory outlook, positive ETF flows, and macroeconomic tailwinds has created a supportive environment for risk assets like Ethereum.
Historically, cryptocurrency rallies driven by multiple positive catalysts simultaneously tend to have greater staying power than moves driven by single factors. The convergence of derivatives momentum, ETF inflows, and regulatory optimism suggests that Ethereum's rally may have more fundamental support than pure technical bounce.
Key Risks and Considerations ⚠️
Investors considering Ethereum positions should carefully weigh several risks:
- Overbought technicals may trigger profit-taking or consolidation
- Leverage concentration near current levels creates liquidation cascade risk
- Macroeconomic sensitivity means that disappointing economic data could reverse sentiment
- Regulatory uncertainty persists despite recent positive developments
- Geopolitical factors could impact risk appetite more broadly
What Comes Next for Ethereum? 🔮
The path forward for Ethereum will likely depend on whether the asset can consolidate its gains above $2,250 while the RSI normalizes. A daily close above $2,300 would provide meaningful confirmation of the breakout's validity and open pathways toward $2,500.
However, traders should remain mindful that overbought conditions can persist for extended periods during strong rallies, and pullbacks are a normal part of any significant advance. The key will be watching whether support levels hold during any consolidation phase.
The next 24–48 hours will be critical in determining whether Ethereum's rally has genuine legs or represents an overextended move ripe for profit-taking. Close attention to volume patterns, liquidation activity, and macroeconomic developments will provide clues about the likely direction of prices.
Conclusion: Opportunity Amid Caution 📈
Ethereum's surge toward $2,500 represents one of the most compelling price action stories in cryptocurrency markets this year. The combination of derivatives momentum, positive ETF flows, and improving regulatory sentiment has created a powerful cocktail of bullish factors.
Yet the overbought RSI reading and concentrated liquidation clusters near current levels serve as important reminders that not all rallies proceed in straight lines. Savvy traders will likely wait for consolidation and RSI normalization before establishing fresh long positions, while those already holding Ethereum should consider taking partial profits at resistance levels.
The $2,500 target remains achievable, but the journey there will likely involve periods of consolidation and minor pullbacks. For Ethereum investors, the key is maintaining discipline, managing risk appropriately, and remembering that even strong rallies benefit from occasional pauses.
You May Also Like

Market Analysis
XRP Price Falls 5% as Leverage Hits Seven-Month High
August 26, 2026

Market Analysis
Crypto Market Hits Extreme Greed: What This Means for Bitcoin
August 26, 2026

Market Analysis
Ethereum Price Rally Overheats Below $2,550 Resistance
August 26, 2026

Market Analysis
Hyperliquid Price Rally: HYPE Targets $97 Amid $80 Support
August 25, 2026