Category:
Market AnalysisEthereum Price Falls Below $1,900: Critical Support Levels Explained

Ethereum's Sharp Decline: What's Happening Right Now 📉
Ethereum is facing significant selling pressure, with ETH trading near $1,883—down approximately 1.8% on the daily chart. This pullback represents a critical moment for the world's leading smart contract platform, as buyers have repeatedly failed to maintain momentum above the $2,000 psychological barrier. The rejection at this key resistance level has triggered a cascade of technical selling and liquidations that are now testing crucial support zones.
The current price action tells a compelling story about market sentiment and trader positioning. After reaching an intraday high of $1,936, Ethereum encountered fierce resistance from sellers who aggressively defended the $1,900 level. This defensive behavior suggests that many traders view current prices as an opportunity to take profits rather than accumulate additional exposure.
Understanding the Technical Breakdown ⚙️
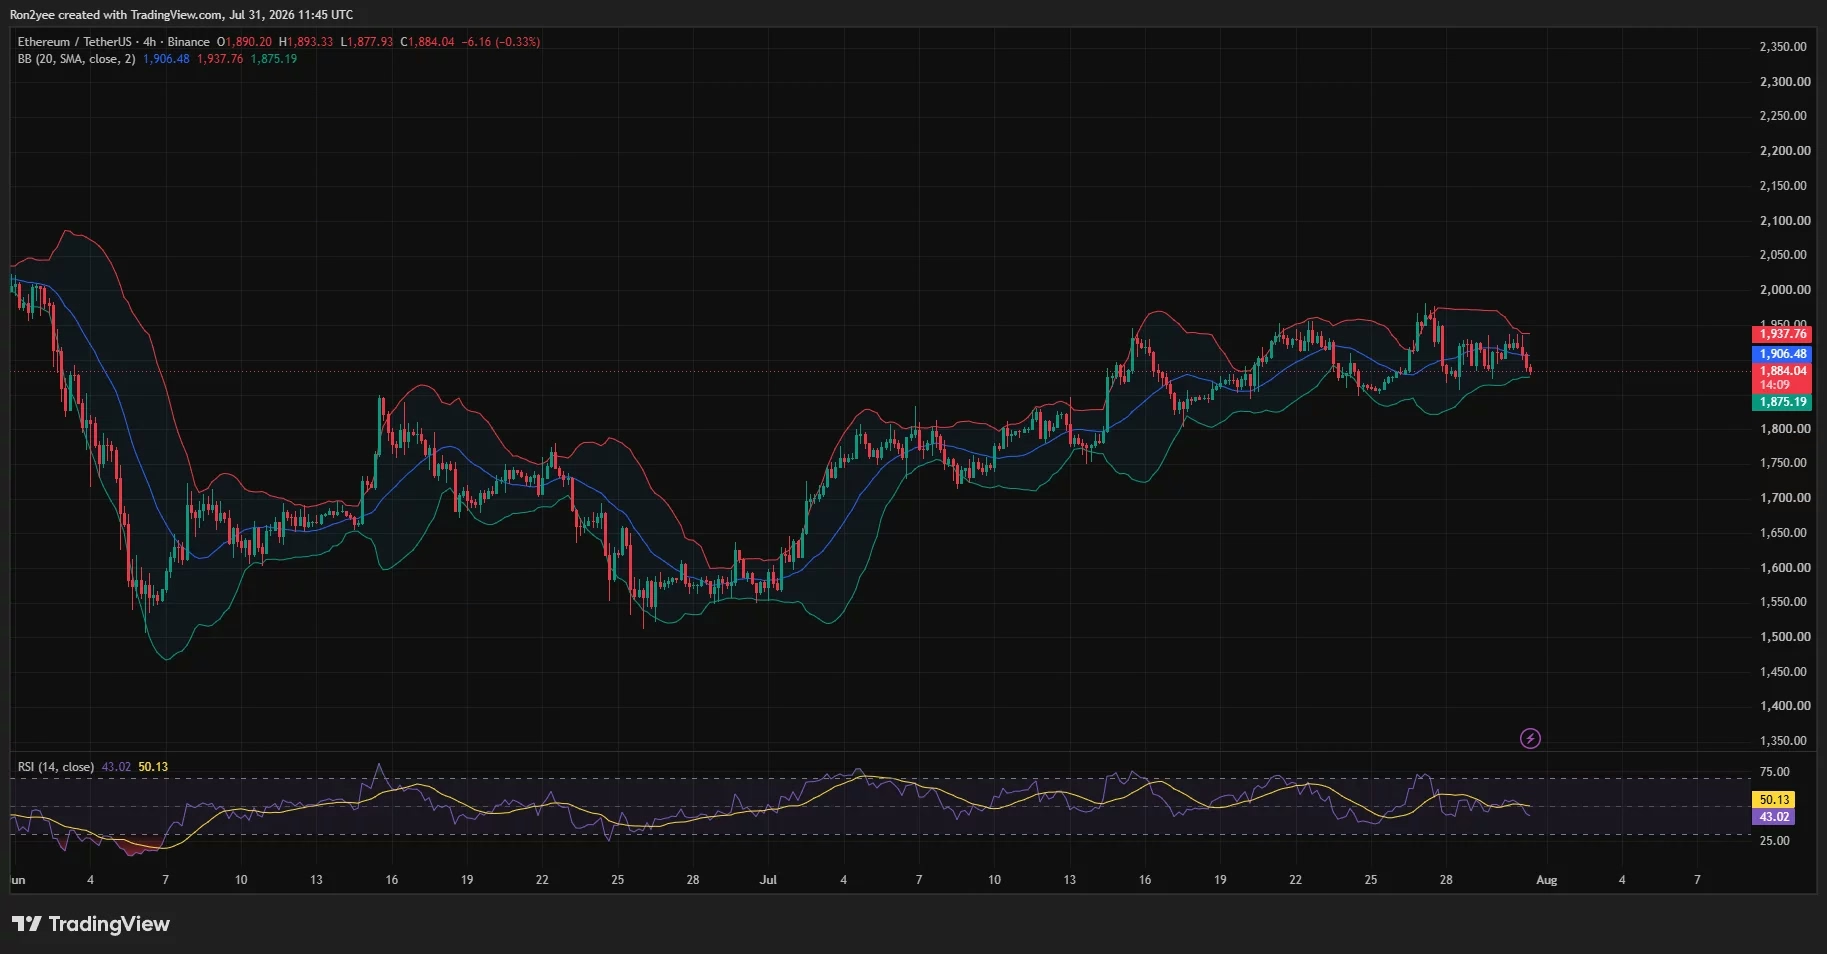
The technical indicators painting the current picture are decidedly bearish in the short term. On the 4-hour timeframe, Ethereum has broken below the middle Bollinger Band at $1,906, pushing the token perilously close to the lower band at $1,875. This breakdown is particularly significant because it represents a shift in the balance of power from buyers to sellers.
The Relative Strength Index (RSI) on the 4-hour chart has deteriorated to 43.02, falling below its 50-period moving average of 50.13. While this reading hasn't reached oversold conditions (which typically occur below 30), it clearly demonstrates that selling momentum is gaining traction. An RSI below 50 generally indicates that sellers have seized control of the price action, at least in the near term.
Key technical observations:
- ETH trading range: $1,878 to $1,936 intraday
- 4-hour RSI: 43.02 (weakening momentum)
- Middle Bollinger Band: $1,906 (broken)
- Lower Bollinger Band: $1,875 (potential floor)
The $1,850 Support Question: Will It Hold? 🎯
The most pressing question for Ethereum traders is whether the $1,850 support level will maintain its integrity. This price point represents more than just another technical level—it's a confluence of multiple support indicators that could prove decisive for the broader recovery narrative.
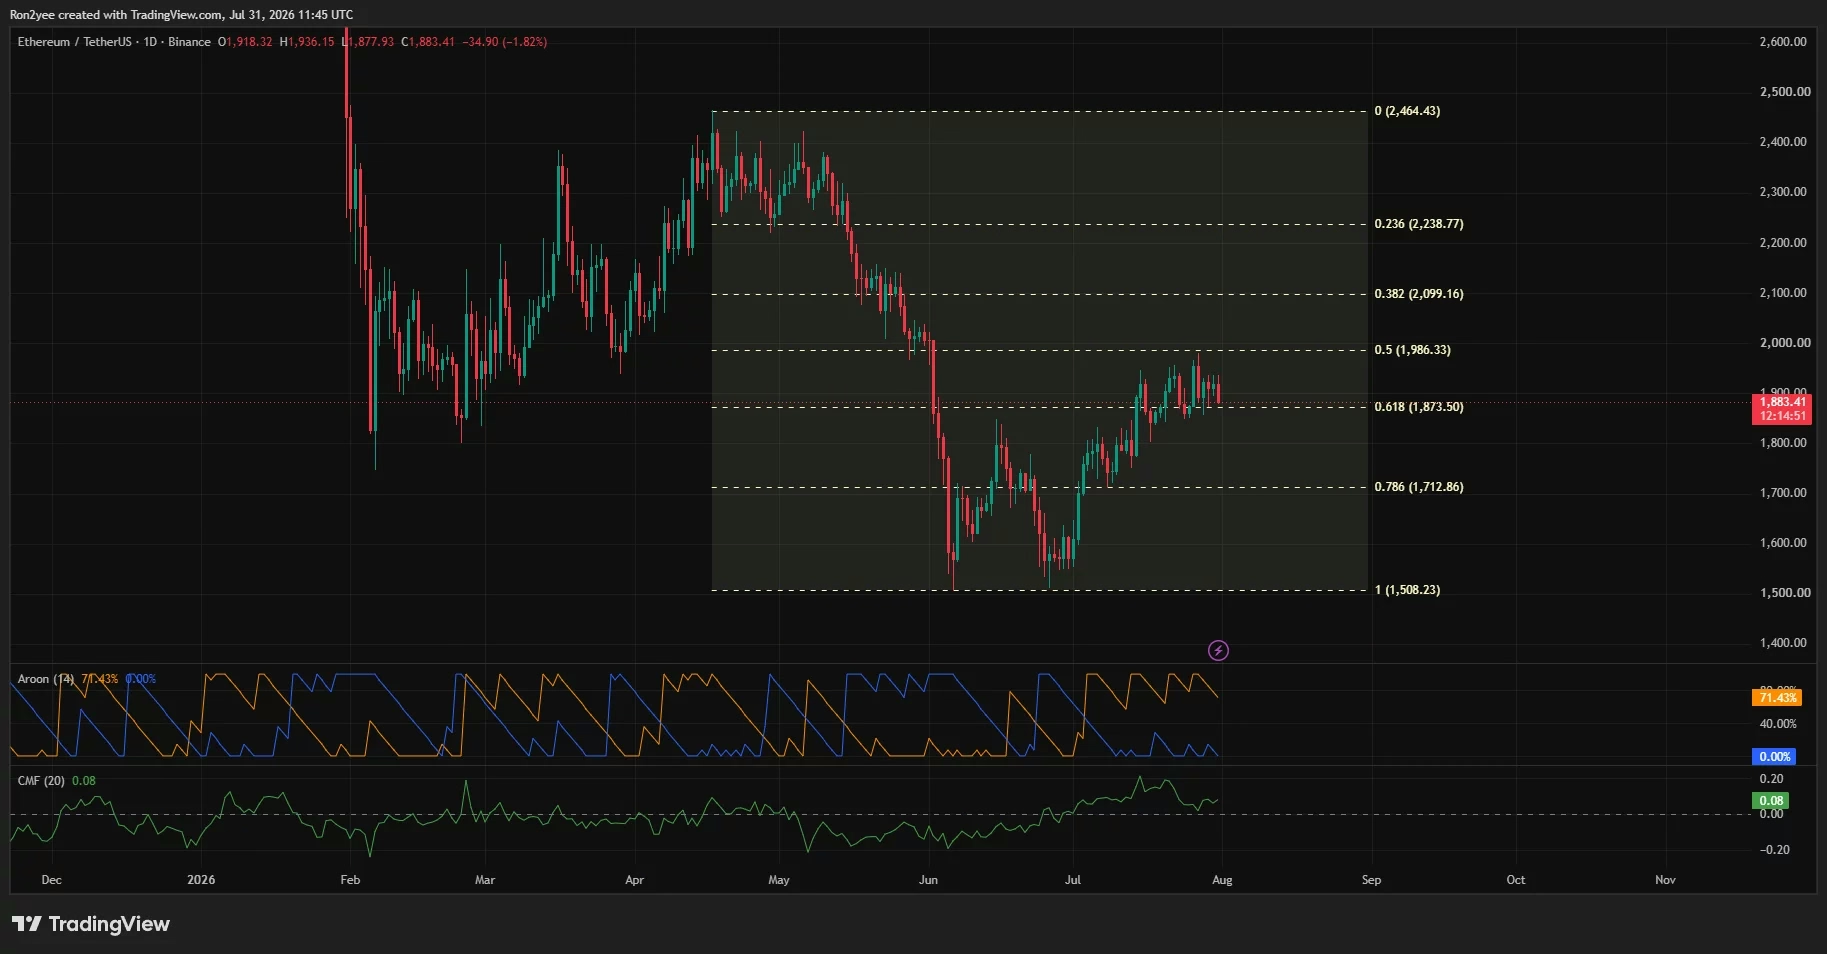
The daily chart reveals that $1,873 to $1,875 represents the first critical support zone. The 0.618 Fibonacci retracement sits at $1,873.50, while the 4-hour lower Bollinger Band stands at $1,875.19. This convergence creates a technically significant area where buyers traditionally step in to defend further declines.
If Ethereum closes below $1,873 on the daily chart, the recovery structure that formed from the late-June lows would be compromised. Such a break would likely trigger additional selling as traders reassess their positions and stop-loss orders execute automatically. The next layer of liquidity clusters between $1,850 and $1,870, making this zone the subsequent downside target if initial support fails.
Liquidation Dynamics Driving Price Action 💥
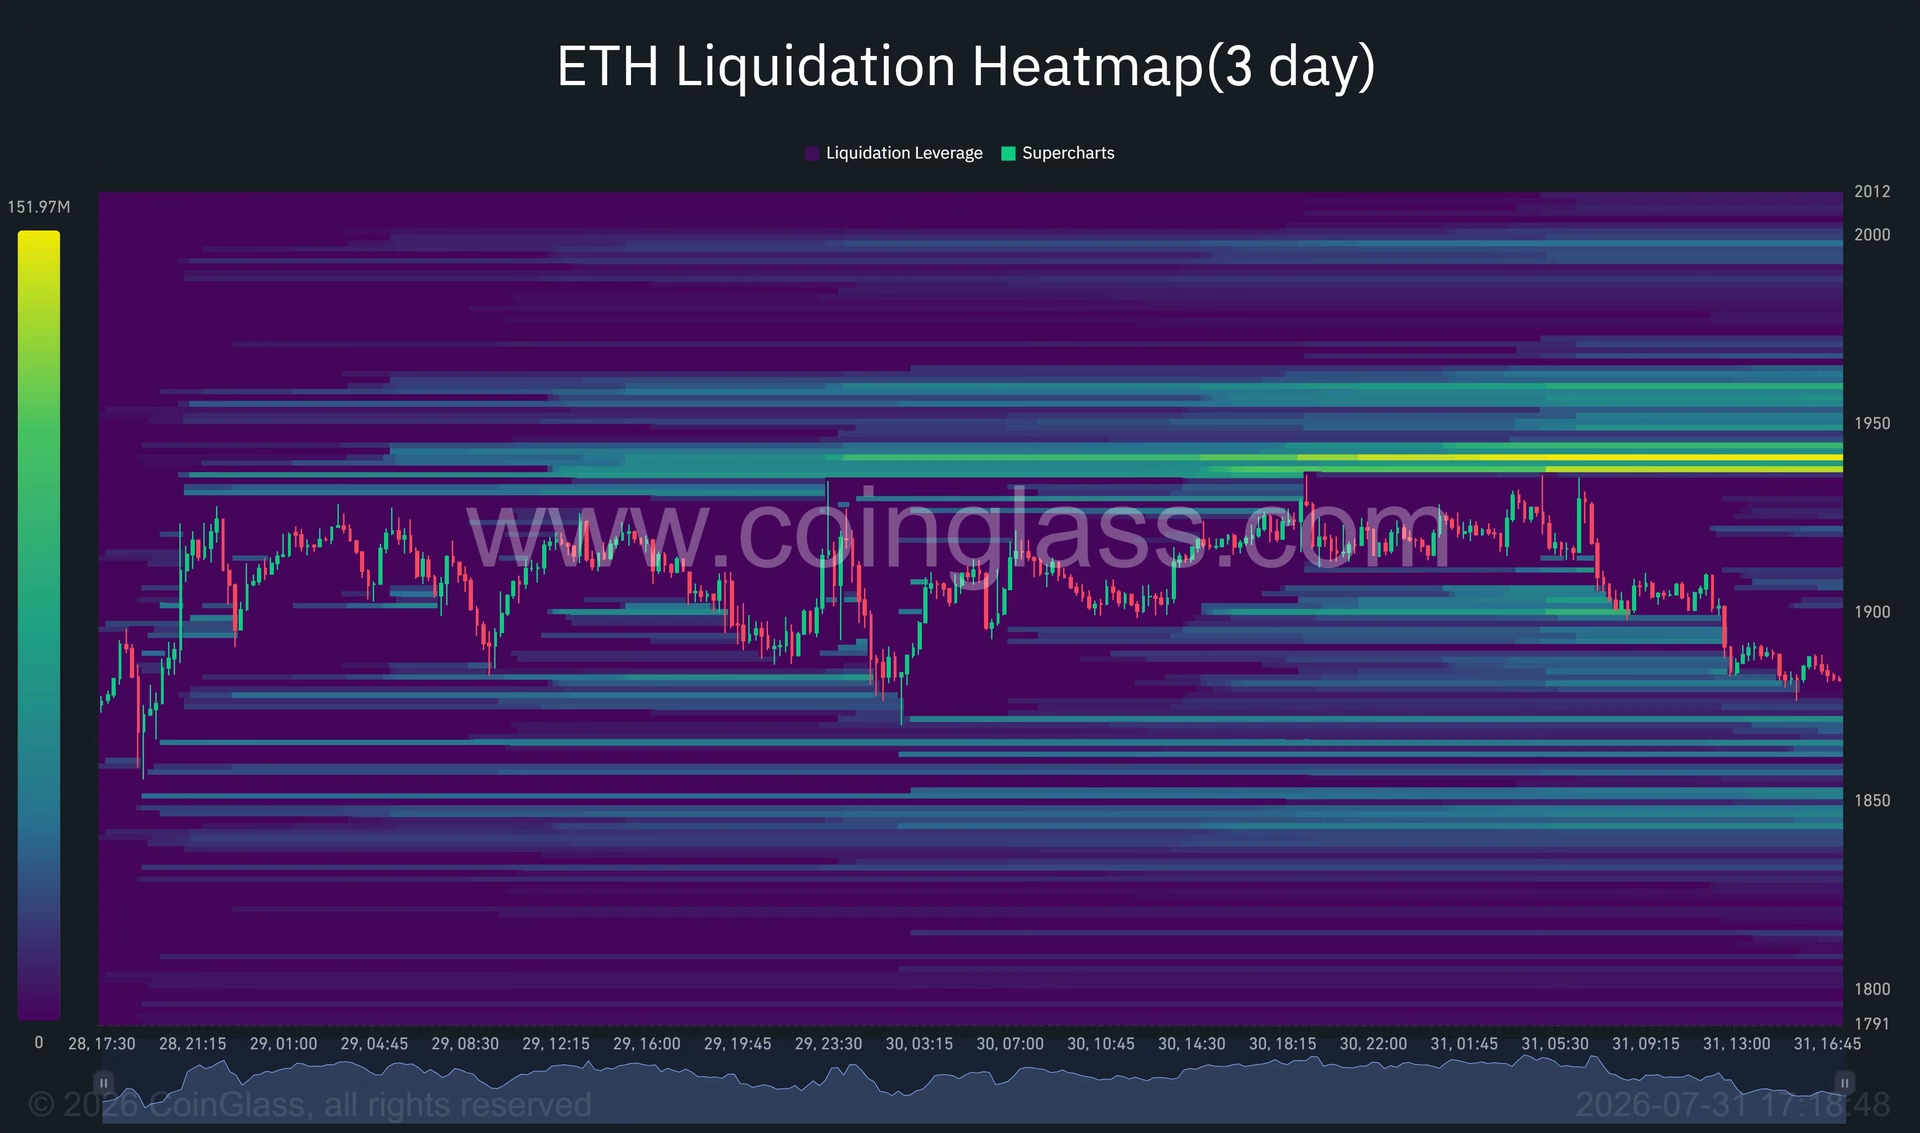
One of the most important factors influencing Ethereum's current price trajectory is the distribution of leveraged positions across different price levels. The 3-day CoinGlass liquidation heatmap reveals crucial information about where traders have concentrated their bets, and this data has profound implications for future price movements.
ETH dropped sharply after trading around $1,920, cascading through liquidity near $1,900 before settling in the upper $1,880s. This sharp descent wasn't coincidental—it reflects the forced liquidation of leveraged long positions as prices fell below key support levels. When margin traders face pressure from adverse price movements, exchanges automatically liquidate their positions, which accelerates downward momentum and can create a self-reinforcing cycle of selling.
The liquidation heatmap shows the largest concentration of leveraged positions clustered around $1,935–$1,940. This area represents a critical price magnet that could attract buyers during a recovery attempt. If Ethereum can reclaim $1,906 (the middle Bollinger Band), it would signal that short-term momentum is stabilizing. A recovery push toward $1,938 would encounter resistance at the upper Bollinger Band and overlap with the main liquidation pocket, potentially triggering a short squeeze if buyers can break through.
Why $2,000 Remains Elusive 🚧
The repeated failures to establish support above $1,930 reveal a fundamental challenge facing Ethereum bulls: the $2,000 level has become a formidable barrier that sellers are determined to defend. This psychological round number coincides with the 50% Fibonacci retracement at $1,986.33 on the daily chart, creating a wider resistance zone that has attracted significant short-term trading activity.
Profit-taking near $1,950 has amplified the selling pressure at higher price levels. Traders who entered positions during the earlier recovery are increasingly closing positions rather than adding exposure, which suggests a lack of conviction about immediate upside potential. This profit-taking behavior, combined with technical resistance, has created an environment where buyers struggle to establish sustained momentum.
Macroeconomic Headwinds Weighing on Risk Assets 🌍
Beyond the technical factors, Ethereum's weakness reflects broader challenges affecting risk assets globally. The Federal Reserve's decision to maintain elevated interest rates has created restrictive financing conditions for US investors, making leveraged positions more expensive and less attractive. Higher interest rates increase the cost of borrowing, which directly impacts the profitability of leveraged trading strategies.
Geopolitical uncertainty in the Middle East has also contributed to a more defensive market posture among investors. During periods of heightened geopolitical tension, capital tends to flow toward safer assets, reducing demand for speculative positions in cryptocurrency markets. This defensive sentiment has created headwinds for Ethereum and other risk assets that depend on investor appetite for growth-oriented investments.
Additionally, Ethereum has lacked the sustained spot demand necessary to overcome these macro pressures. Weak on-chain activity metrics and redemptions from spot Ethereum exchange-traded products have eliminated two potential sources of buying support. These ETF redemptions are particularly concerning because they represent institutional investors reducing their exposure, which signals a shift in professional sentiment.
What Happens Below $1,850? 📊
Should Ethereum break decisively below $1,850, attention would shift toward the $1,800 psychological level. Losing support at $1,800 could expose the 0.786 Fibonacci retracement at $1,712.86, although such a deep correction would require a significant deterioration in market conditions. The distance between $1,850 and $1,712 represents approximately 1.6% downside, which would constitute a substantial move in the current context.
However, longer-term indicators suggest that the broader recovery structure remains intact despite the near-term weakness. The Chaikin Money Flow stands at 0.08 on the daily chart, indicating that capital flows remain marginally positive despite the price decline. The Aroon indicator readings show Aroon Up at 71.43 and Aroon Down at zero, suggesting that the July recovery has not been fully invalidated by the current pullback.
These medium-term positive indicators contrast sharply with the weaker 4-hour RSI, creating a mixed technical picture. The market appears to be in a state where the recovery structure remains sound, but near-term momentum clearly favors sellers. This divergence suggests that the current decline may represent a healthy consolidation rather than a complete reversal of the broader uptrend.
Recovery Scenarios and Resistance Clusters 🔄
If buyers can successfully defend the $1,873–$1,875 support zone, a recovery push would face resistance at $1,906 (middle Bollinger Band) and then at $1,938 (upper Bollinger Band). Breaking through $1,938 would be crucial because it overlaps with the main liquidation cluster at $1,935–$1,940. A successful breach of this area could trigger a short squeeze, attracting additional buying from traders who had been betting on further declines.
Above $1,940, additional liquidity clusters appear near $1,950–$1,965 and immediately below $2,000. These areas could either fuel continued momentum or attract fresh selling as traders defend the wider resistance zone. The interaction between buyers and sellers at these levels will likely determine whether Ethereum can make another attempt at $2,000 or whether it must consolidate further.
Failure to recover above $1,900 would keep the downside scenario active and could make leveraged positions accumulated around $1,875 and $1,850 increasingly vulnerable to further liquidations.
What The Experts Are Saying 👨💼
Crypto market analysts remain divided on Ethereum's near-term trajectory, though many maintain constructive longer-term perspectives. Respected analyst Michaël van de Poppe has characterized the current decline as a lower-timeframe correction while maintaining a positive longer-term outlook. He emphasizes that as long as Ethereum holds above $1,800, there's minimal cause for concern, and he continues to expect the token to reach $2,500 in the coming months.
Other technical analysts have identified the narrower support range around $1,850 as the key level to watch. These experts note that while momentum is weakening after ETH fell below $1,900, the token's ability to remain above $1,850 suggests that the recovery structure remains viable. Many analysts believe that as long as $1,850 holds, Ethereum is more likely to rally toward $2,000 rather than experience a deeper correction.
The Bottom Line: Ethereum at a Crossroads 🔀
Ethereum currently stands at a critical decision point that will determine whether the recent recovery continues or whether a more significant consolidation period is necessary. The $1,850 support level has emerged as the most important price to watch, with a break below this level potentially opening the door to deeper declines toward $1,800 and beyond.
However, the mixed signals from technical indicators—with longer-term metrics remaining constructive while short-term momentum deteriorates—suggest that this pullback may represent a healthy consolidation rather than a trend reversal. Traders should monitor the $1,873–$1,875 support zone closely for signs of either capitulation or stabilization.
For investors with longer time horizons, the current weakness may present an opportunity to accumulate exposure at lower prices, particularly if the $1,850 support holds firm. Conversely, traders focused on near-term price action should remain cautious until Ethereum can convincingly reclaim the $1,900 level and establish renewed momentum toward $2,000.
The next 24-48 hours will likely prove decisive in determining which scenario plays out. 📈
You May Also Like

Market Analysis
XRP Price Falls 5% as Leverage Hits Seven-Month High
August 26, 2026

Market Analysis
Crypto Market Hits Extreme Greed: What This Means for Bitcoin
August 26, 2026

Market Analysis
Ethereum Price Rally Overheats Below $2,550 Resistance
August 26, 2026

Market Analysis
Hyperliquid Price Rally: HYPE Targets $97 Amid $80 Support
August 25, 2026