Category:
Market AnalysisEthereum Price Rebounds 3% Above $1,900 on CPI Data

Ethereum's Bullish Recovery Gains Momentum 📈
Ethereum has staged a compelling recovery that captures the attention of market participants watching for signs of renewed strength in the cryptocurrency sector. On August 12, the second-largest blockchain platform by market capitalization surged approximately 3% from its $1,850 support level, reclaiming the psychologically significant $1,900 threshold that had proven elusive throughout the previous trading week.
The rebound reflects a broader market dynamic where softer-than-expected inflation readings have reignited investor appetite for risk assets. When macroeconomic headwinds ease, capital tends to flow toward digital assets that benefit from expanded monetary liquidity and reduced interest rate pressure. This fundamental shift in sentiment provided the catalyst for Ethereum's latest price action.
The CPI Effect: How Inflation Data Supports ETH Recovery 💹
The U.S. Bureau of Labor Statistics released its July Consumer Price Index report during the morning trading session, revealing cooling inflationary pressures across the economy. This data point carries outsized importance for Ethereum and other cryptocurrencies because it directly influences Federal Reserve policy expectations.
When inflation moderates, the likelihood of aggressive monetary tightening diminishes. A more dovish Fed stance typically translates into easier financial conditions, lower real yields, and improved demand for alternative assets like Ethereum that thrive in low-interest-rate environments. The market's interpretation of these inflation trends can shift sentiment in minutes, as evidenced by the swift recovery from $1,850 to above $1,918.
Large institutional holders contributed meaningfully to this recovery momentum. Reports indicate that significant Ethereum holders withdrew approximately 30,000 ETH tokens from centralized exchanges during the accumulation phase. While exchange withdrawals don't definitively reveal future intentions, they typically suggest holders are moving assets to self-custody for longer-term positioning rather than immediate liquidation.
Technical Setup: Moving Averages Align in Support 🎯
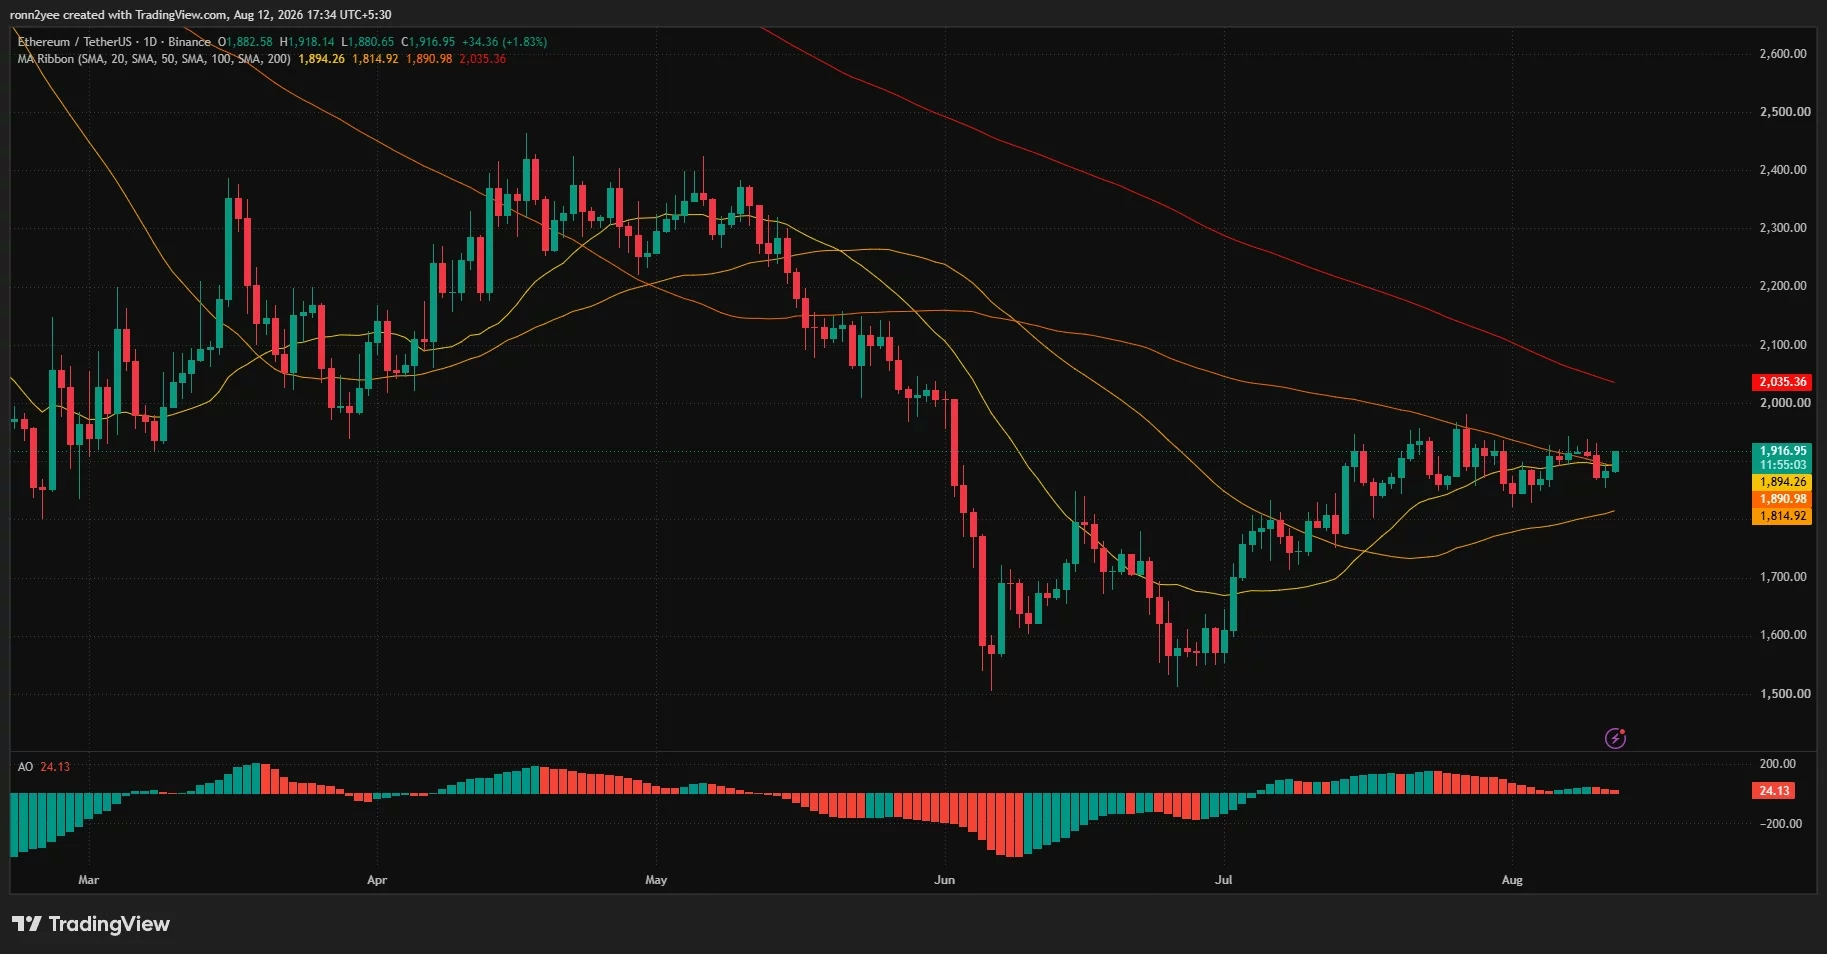
Ethereum's recovery demonstrates meaningful technical improvement across multiple timeframes. The token reclaimed both its 20-day simple moving average (positioned near $1,894) and its 100-day average (approximately $1,891), creating a supportive technical foundation that hadn't existed during the previous downward pressure.
These moving averages now function as an immediate support zone around the $1,890 level. The broader recovery trend from June's lows near $1,520 remains intact, as Ethereum continues trading above its 50-day moving average at $1,815. However, the longer-term picture shows some caution warranted—the token still trades beneath the declining 200-day moving average at $2,035, indicating that the intermediate-term trend remains challenged.
The Awesome Oscillator reading of 24.13 confirms that bullish momentum persists, though recent histogram contractions suggest that momentum needs expansion to sustain a meaningful breakout. Short-term traders monitoring the 4-hour timeframe observe similar dynamics, with the Supertrend indicator remaining bearish and resistance positioned at $1,925.49.
Critical Resistance Levels Define the Path Forward 🚀
For Ethereum to establish a confirmed recovery, the token must navigate several technical hurdles. The immediate resistance band stretches from $1,925 to $1,950, with the higher level representing a particularly important zone due to concentrated leveraged liquidations.
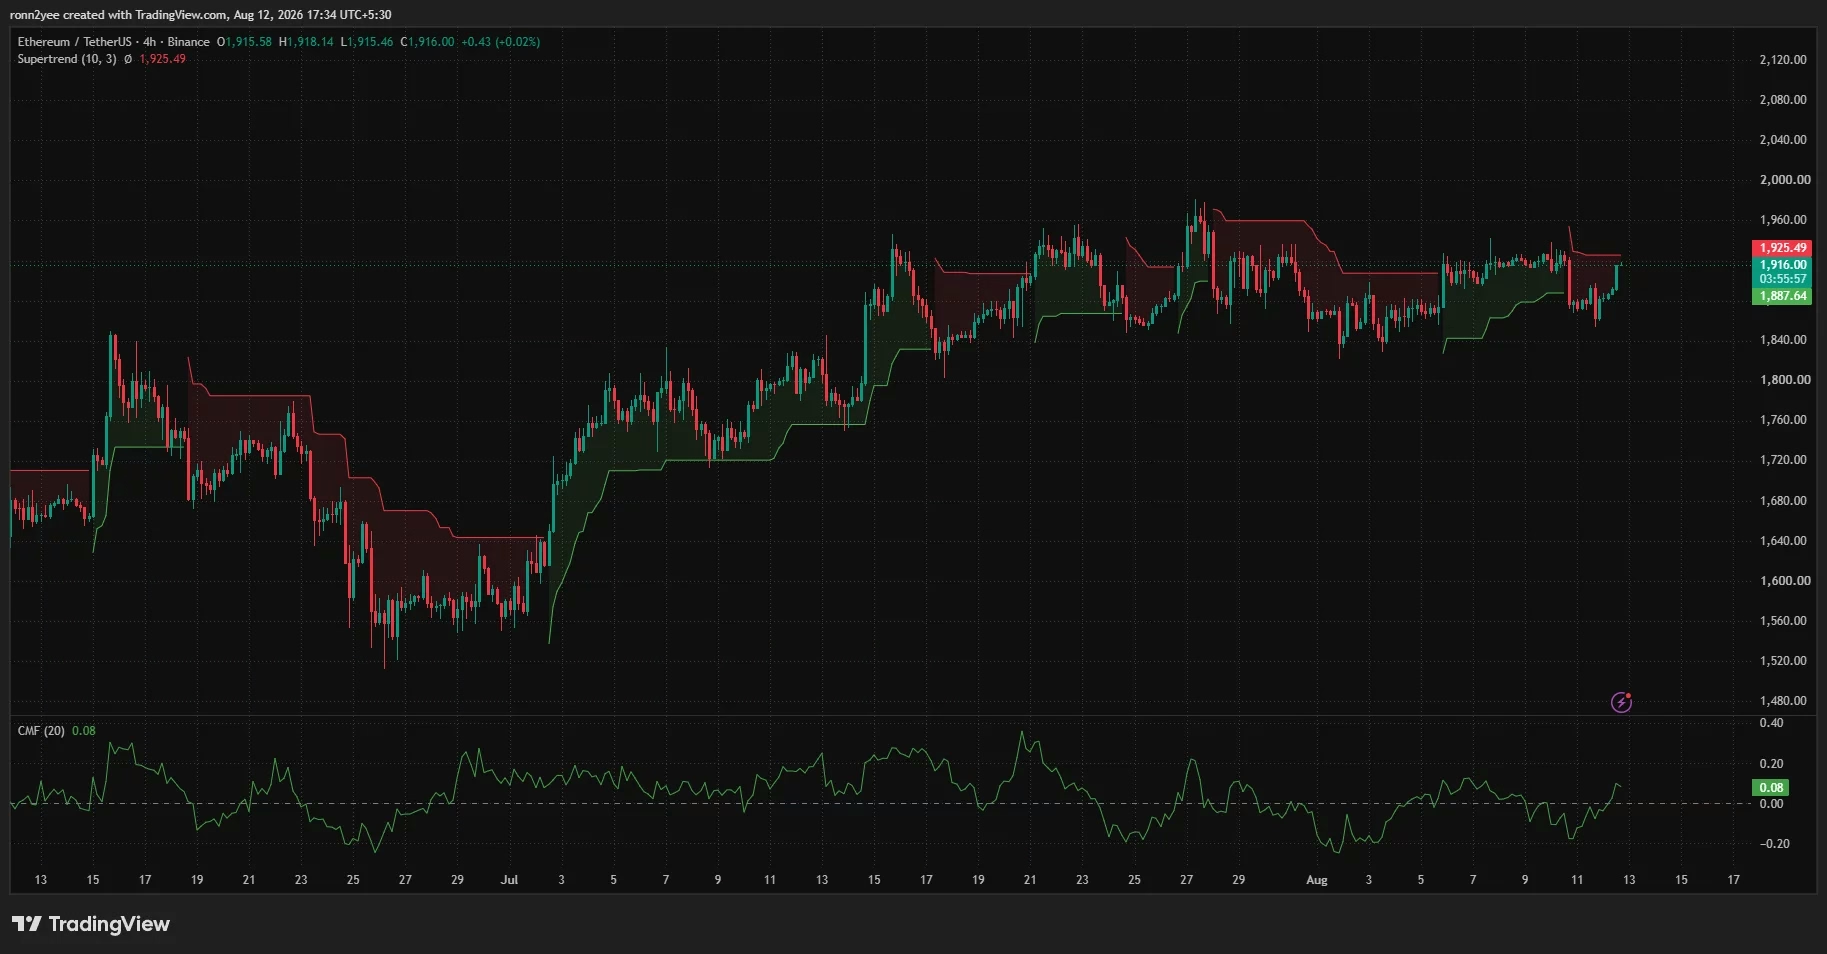
Analysts monitoring CoinGlass liquidation data identified a substantial cluster of short positions around the $1,950 level. This concentration matters because price often gravitates toward areas of dense liquidity, where liquidations can cascade and accelerate moves. A decisive breakout through $1,950 could trigger short-squeeze dynamics, potentially accelerating movement toward the $2,000 psychological level.
The daily 200-day moving average near $2,035 would represent the next major technical test above $2,000. Breaking above this level would signal a meaningful shift in the intermediate-term trend and potentially attract institutional capital that responds to trend confirmation signals.
Downside Risk Scenarios and Support Levels 📊
While the recovery appears constructive, traders must respect the downside risks that remain embedded in the technical structure. The $1,887–$1,890 zone represents the critical support area; failure to hold this level could expose the $1,850 support that provided the foundation for the current rebound.
If Ethereum closes decisively below $1,850, the technical setup weakens materially. Such a breakdown would expose the 50-day moving average near $1,815 and potentially reopen the path toward $1,700. Significant liquidity clusters also exist at $1,840 and below, suggesting that lower support levels could provide temporary stabilization if downside pressure intensifies.
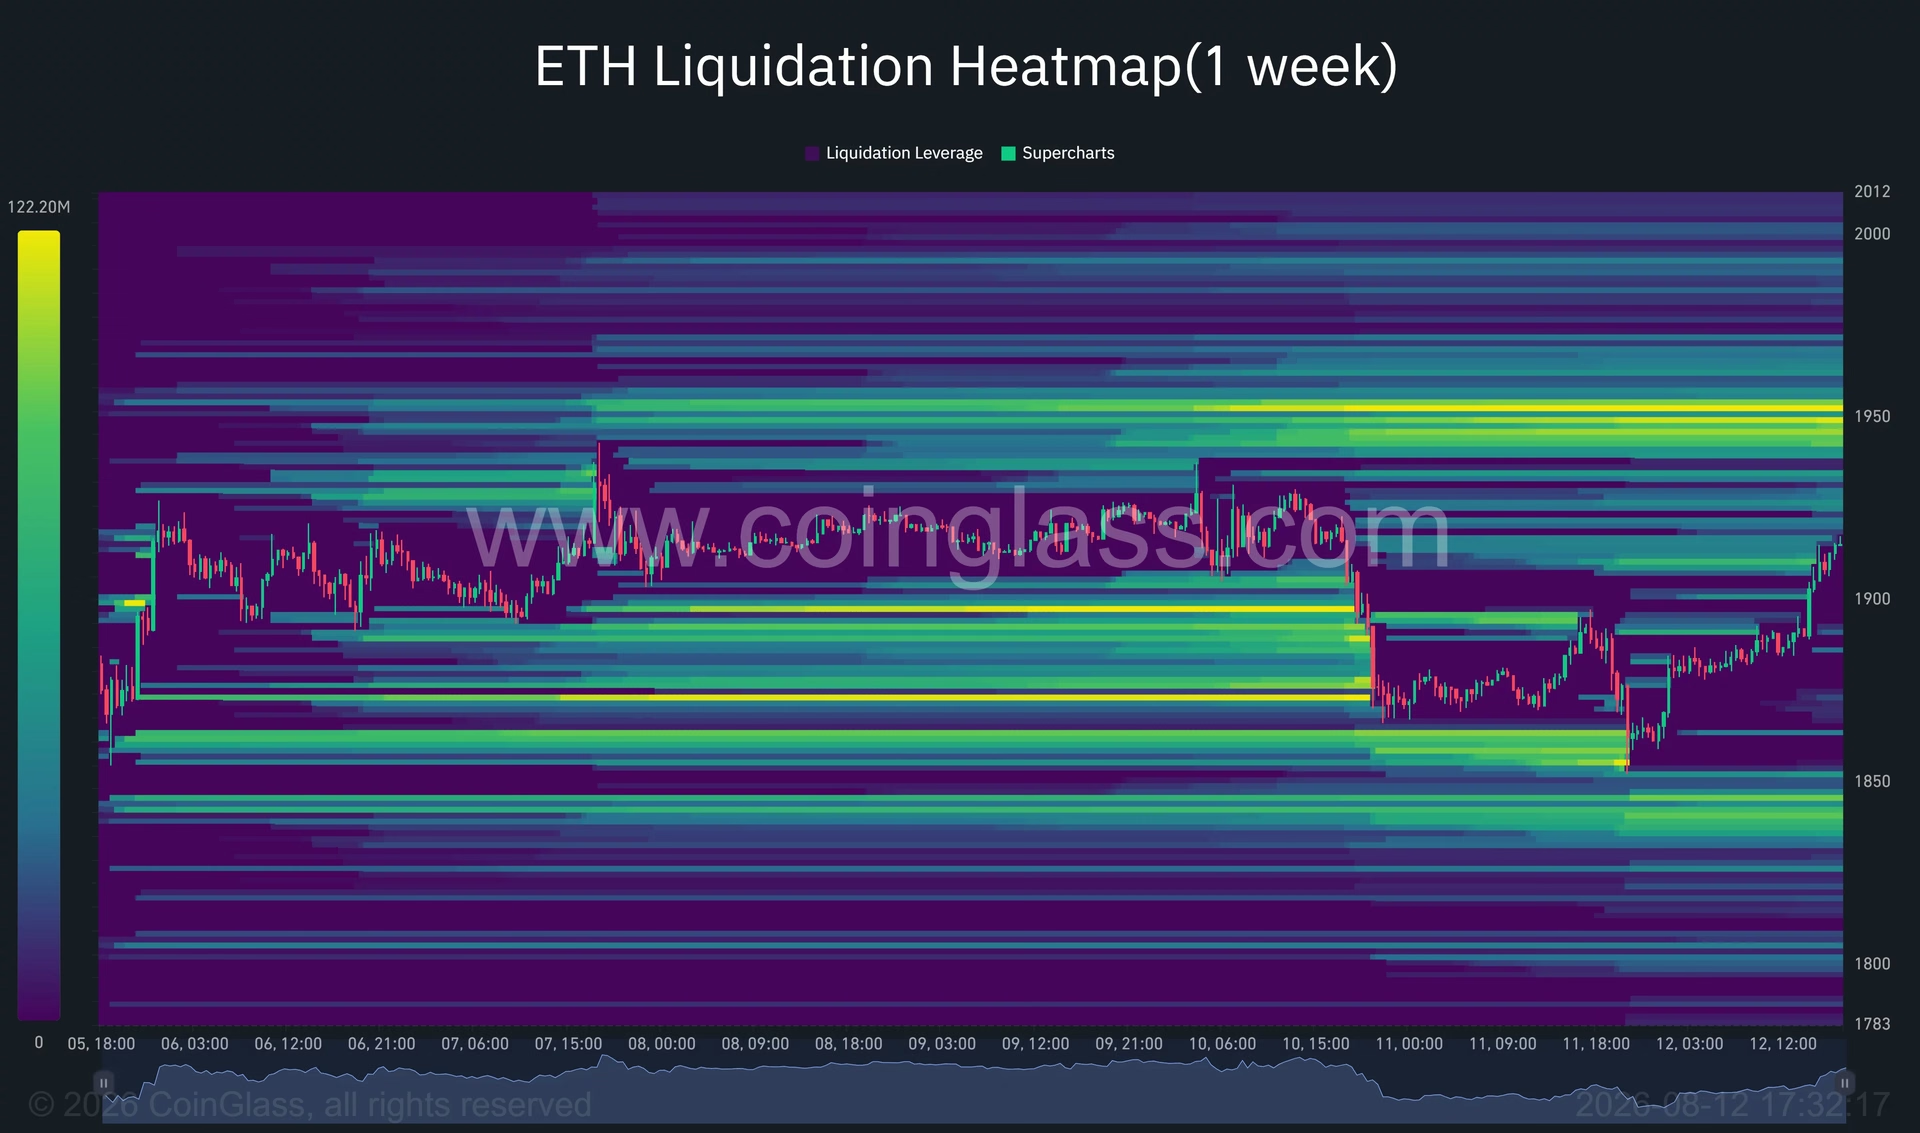
The Chaikin Money Flow indicator has risen to 0.08, reflecting modest net buying pressure. A deeper move into positive territory would provide stronger confirmation that institutional and retail buyers control the short-term trend. Currently, the indicator suggests cautious accumulation rather than aggressive institutional buying.
Analyst Perspectives: Targets and Breakout Scenarios 🔮
Crypto market analysts tracking Ethereum's recovery have offered varying perspectives on likely price targets. Respected technical analyst Ted Pillows noted that Ethereum must reclaim and hold the $1,900–$1,920 range as a prerequisite for extending toward $2,000. The token has successfully entered this critical zone, though closing above it on a daily basis remains necessary for confirmation.
Michaël van de Poppe, another prominent technical analyst, characterized Ethereum's price action as a consolidation pattern featuring higher lows and compressed volatility. He identified $2,300 as his primary target zone if Ethereum achieves a strong breakout above the current range. However, van de Poppe cautioned that any breakout would likely prove highly volatile given the extended period of low-volatility consolidation.
The more immediate technical sequence suggests a more conservative progression: bulls must first secure $1,925, clear the $1,950 liquidation cluster, and reclaim $2,000 before $2,300 becomes technically relevant. This phased approach acknowledges the technical resistance that must be overcome sequentially.
Volume Dynamics Support the Recovery Thesis 📈
Trading volume during the breakout attempt rose approximately 35% above its 20-day average, providing meaningful support for the recovery move. Higher volume lends credibility to price moves, as it reflects broader participation rather than moves driven by thin liquidity.
However, the volume expansion hasn't yet reached the levels typically associated with sustained breakouts. For Ethereum to achieve a confirmed breakout above $1,925–$1,950, volume would need to expand further and sustain above-average levels. This requirement underscores that while the recovery has begun, the heavy lifting still lies ahead.
Market Conditions and Broader Context 🌍
Ethereum's recovery occurs within a broader cryptocurrency market context where macroeconomic data increasingly influences digital asset prices. The correlation between traditional markets and crypto has strengthened considerably, meaning that economic indicators like inflation readings now carry direct implications for Ethereum's direction.
Federal Reserve policy guidance remains the ultimate driver of sentiment, as investors parse every communication for clues about future rate decisions. The timing of any potential rate cuts or pauses in tightening cycles will likely determine whether Ethereum's current recovery proves sustainable or merely represents a temporary bounce within a broader downtrend.
Key Takeaways and What's Next 🎬
Ethereum's 3% rebound to above $1,900 demonstrates that the cryptocurrency remains responsive to macroeconomic conditions and technical support levels. The recovery showcases the importance of inflation data in shaping digital asset valuations and investor sentiment.
The immediate challenge for bulls involves converting the CPI-driven rebound into a confirmed breakout above $1,925–$1,950. Success in this endeavor could unlock movement toward $2,000 and beyond, while failure to hold $1,890 would shift attention back toward $1,850 and lower support zones.
For traders and investors monitoring Ethereum's next move, the key metrics to watch include:
- Daily close above $1,925 to confirm breakout initiation
- Volume expansion above 35% of the 20-day average to validate the move
- Chaikin Money Flow moving deeper into positive territory to signal institutional participation
- Liquidation dynamics around $1,950 that could accelerate upside moves
Ethereum's recovery remains intact for now, but the next directional move fundamentally depends on whether spot demand can sustain the CPI-driven rebound and convert it into a technically confirmed breakout. Market participants should remain vigilant for either confirmation signals that support higher prices or deterioration below key support levels that could reignite downside pressure. ✨
You May Also Like

Market Analysis
XRP Price Falls 5% as Leverage Hits Seven-Month High
August 26, 2026

Market Analysis
Crypto Market Hits Extreme Greed: What This Means for Bitcoin
August 26, 2026

Market Analysis
Ethereum Price Rally Overheats Below $2,550 Resistance
August 26, 2026

Market Analysis
Hyperliquid Price Rally: HYPE Targets $97 Amid $80 Support
August 25, 2026