Category:
Market AnalysisEthereum Price Rebounds: Bulls Eye $1,960 Breakout

Ethereum is staging a compelling recovery that has crypto traders and institutional investors watching closely. 📈 After dipping toward $1,872, the second-largest cryptocurrency has climbed nearly 2% and is now testing critical resistance levels that could determine its near-term trajectory. The question on everyone's mind: can ETH sustain this momentum and break through the $1,960 barrier that analysts have identified as the key to unlocking stronger gains?
The Current Ethereum Price Action 🔍
On August 17, Ethereum demonstrated solid buyer interest, trading around $1,908 and establishing an intraday high near $1,912. This represents a meaningful recovery from the session's low point at $1,872. What's particularly noteworthy is that buyers successfully defended support at the $1,890 level—a price point that had limited advances during the previous three trading sessions.
The bounce accelerated once ETH reclaimed the $1,890 zone, with institutional and retail buyers pushing the token decisively through $1,900. However, this move hasn't yet produced a confirmed breakout from Ethereum's wider August trading range, which has been bounded between $1,850 and $1,960.
Understanding Ethereum's Trading Range 📊
Since late July, Ethereum has been consolidating within a relatively tight corridor. The upper boundary at $1,960 has proven particularly stubborn, with multiple breakout attempts failing to establish a sustained move above this level. Meanwhile, dips toward $1,850–$1,870 continue to attract value-oriented buyers, suggesting this zone functions as a psychological and technical support floor.
This price action reflects a broader market dynamic: Ethereum remains approximately 47% below its price from one year ago, despite recovering substantially from its June lows near $1,530. The token's inability to decisively break higher suggests that traders remain cautious about committing significant capital to the upside.
The August 17 bounce, therefore, should be viewed as another test of the range ceiling rather than confirmation of a broader uptrend. For a genuine shift in market sentiment, Ethereum needs to accomplish something it hasn't done consistently in weeks: close firmly above $1,960.
Whale Activity and Staking Signals Bullish Sentiment 🐋
On-chain metrics provided an encouraging backdrop for the price recovery. An unknown address transferred 32,400 ETH—valued at approximately $61.46 million—into Ethereum's Beacon deposit contract. While the specific identity remains unclear, blockchain analytics suggest potential association with Bitpanda, a major European cryptocurrency exchange.
This deposit is significant for several reasons. First, staking ETH removes tokens from immediate spot market circulation, potentially reducing selling pressure. Second, large institutional deposits signal confidence in Ethereum's long-term value proposition. However, it's important to note that one transaction alone doesn't confirm that the depositor purchased during the current rebound—they may have staked previously acquired holdings.
The staking narrative aligns with Ethereum's broader network health. The network currently secures over $19 billion in staked ETH, representing approximately 26% of the total supply. This high participation rate demonstrates sustained institutional and retail confidence in Ethereum's proof-of-stake consensus mechanism.
Research Developments Support the Technical Case 🔬
Beyond price action and on-chain metrics, Ethereum's development roadmap continues to attract attention. Ethereum co-founder Vitalik Buterin recently highlighted Bitcoin's Utreexo model as Ethereum researchers explore native UTXOs and recursive STARK proofs. These technical innovations address a critical challenge facing Ethereum: the cost and hardware requirements of running full nodes.
The proposed approach would allow nodes to verify relevant data without storing the network's entire state locally—a significant improvement that could democratize node operation and strengthen network decentralization. While this remains a research direction rather than a scheduled upgrade, it demonstrates that Ethereum's development community continues tackling scalability and accessibility challenges.
This technical progress matters because it supports the narrative that Ethereum is evolving beyond its current limitations. For traders and investors, it reinforces the case that the protocol has genuine utility improvements on the horizon.
Technical Analysis: The 4-Hour Momentum Shift ⚡
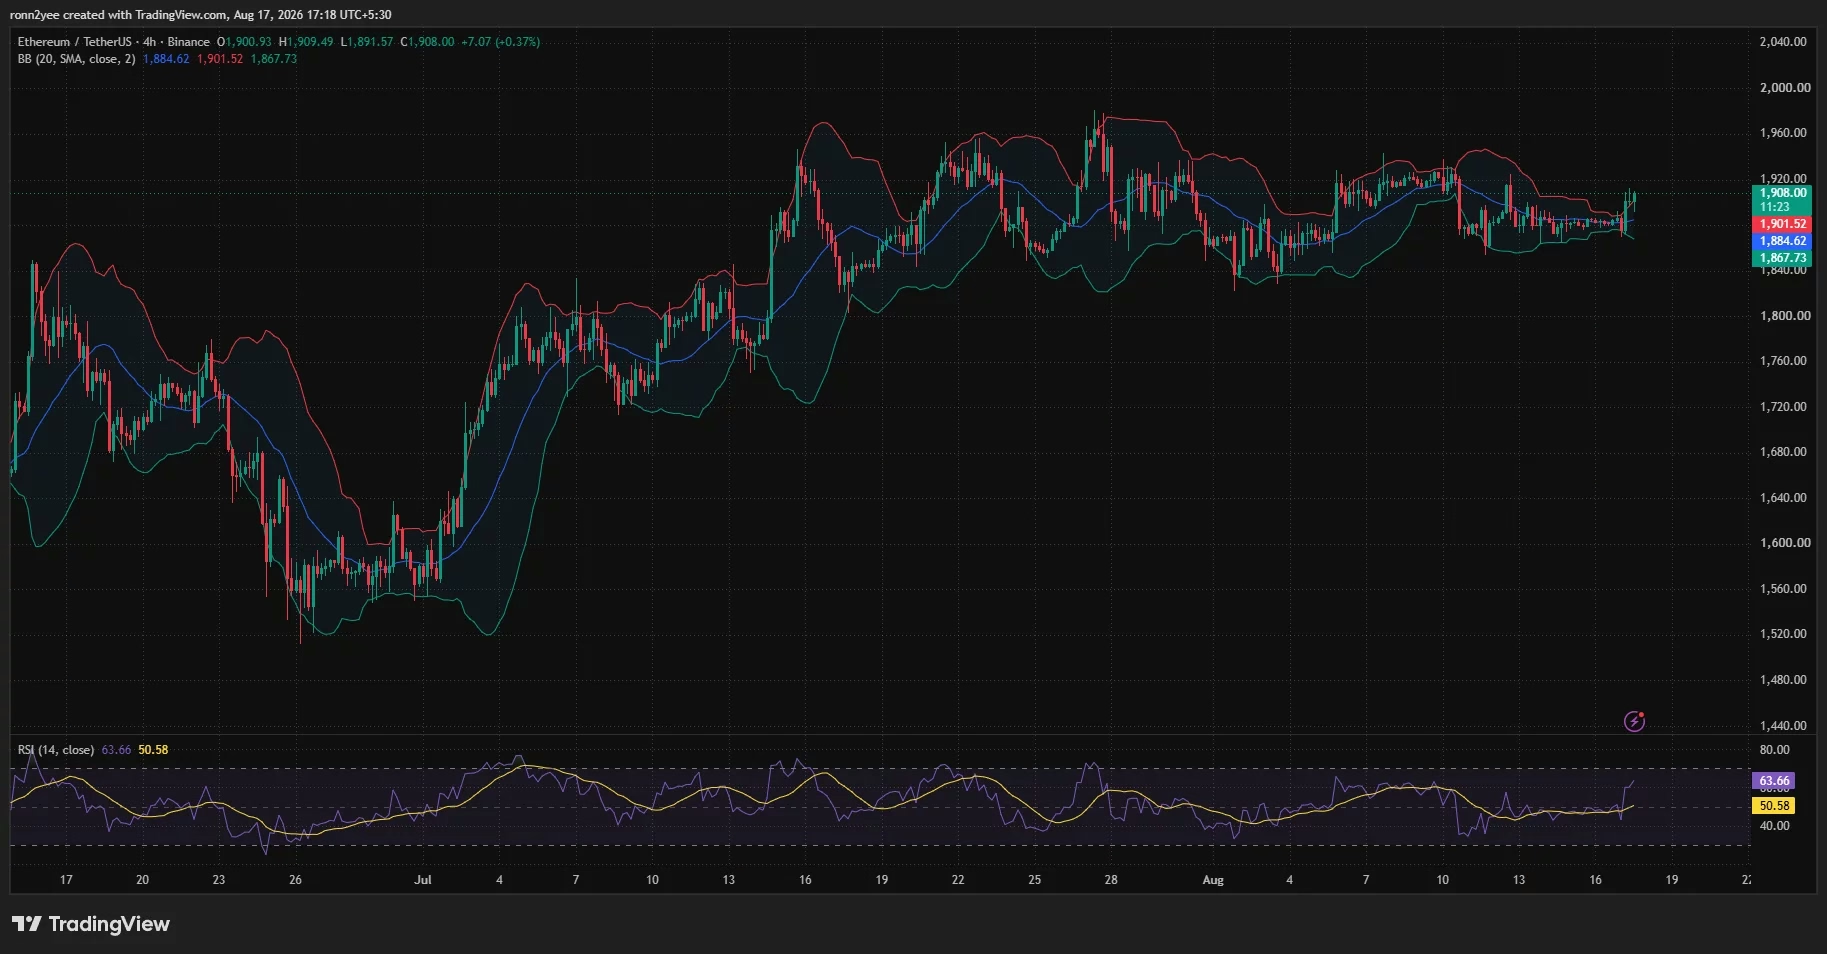
Examining Ethereum's technical setup reveals why the current price action has attracted attention from momentum traders. On the 4-hour timeframe, short-term indicators have shifted decisively in favor of buyers.
ETH has moved above the Bollinger Band midpoint at $1,884 and briefly crossed the upper band near $1,902. This move above the upper band signals strengthening momentum, though it also carries the risk of a pullback if buyers fail to maintain the breakout. The immediate support zone now sits between the $1,884 midpoint and the lower band near $1,868.
The 4-hour relative strength index (RSI) has risen to 63.66 from a neutral average of 50.58. This reading remains comfortably below the overbought threshold of 70, indicating that momentum has room to strengthen further without entering dangerous territory. The rapid acceleration from neutral to moderately bullish levels suggests genuine buyer interest rather than a false breakout.
The Daily Chart: A More Cautious Perspective 📉
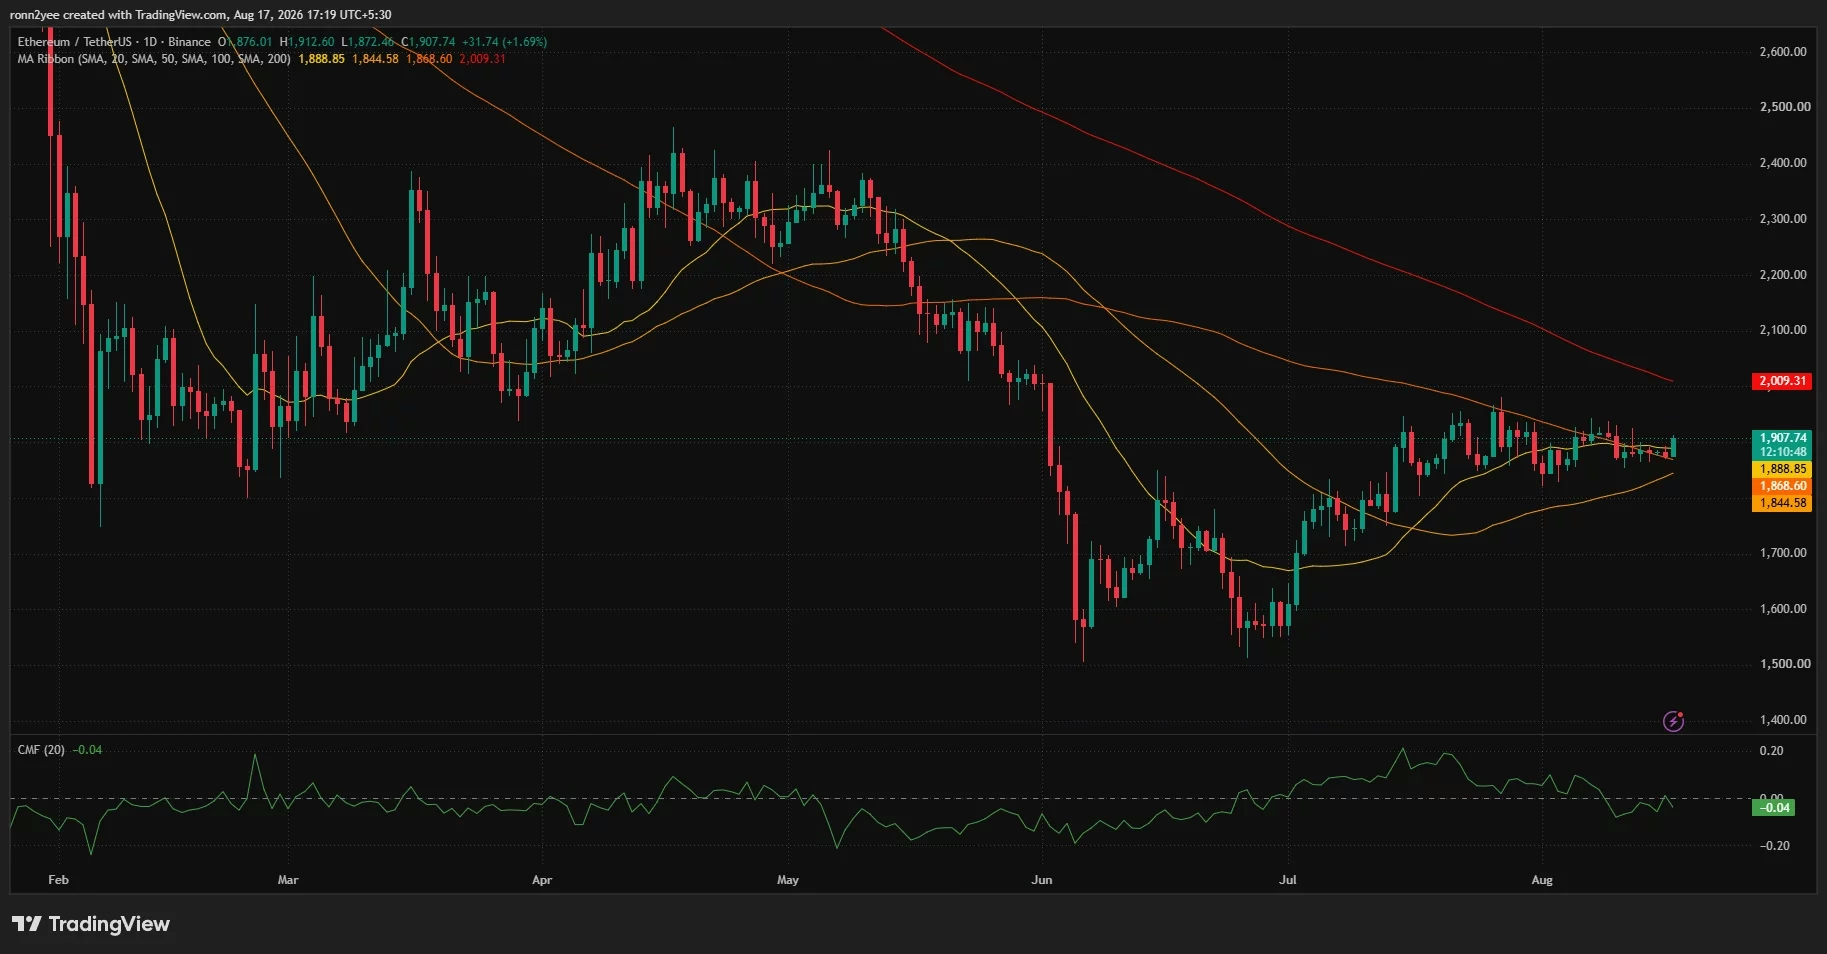
While the 4-hour setup looks encouraging, the daily timeframe tells a more measured story. Ethereum is currently trading above its 20-day, 50-day, and 100-day simple moving averages, positioned near $1,889, $1,845, and $1,869 respectively. Maintaining positions above this cluster of moving averages preserves the recovery structure that has developed since June's lows.
However, the 200-day moving average presents a significant hurdle at approximately $2,009. For Ethereum's longer-term chart to shift decisively in favor of bulls, the token must clear this level. Currently, ETH sits roughly $100 below this critical barrier—a meaningful but achievable distance.
The daily Chaikin Money Flow reading stands at minus 0.04, indicating that selling pressure still slightly exceeds buying pressure on a capital flow basis. This suggests the current price rebound, while encouraging, hasn't yet received strong confirmation from institutional capital flows. A move above $1,925 could change this dynamic by triggering short-covering rallies.
Liquidation Levels: The Roadmap to $1,960 🗺️
CoinGlass's one-week Ethereum liquidation heatmap reveals crucial information about leveraged positioning and potential price targets. A substantial concentration of leveraged positions exists around $1,920–$1,930, with the brightest liquidity band sitting precisely at $1,925.
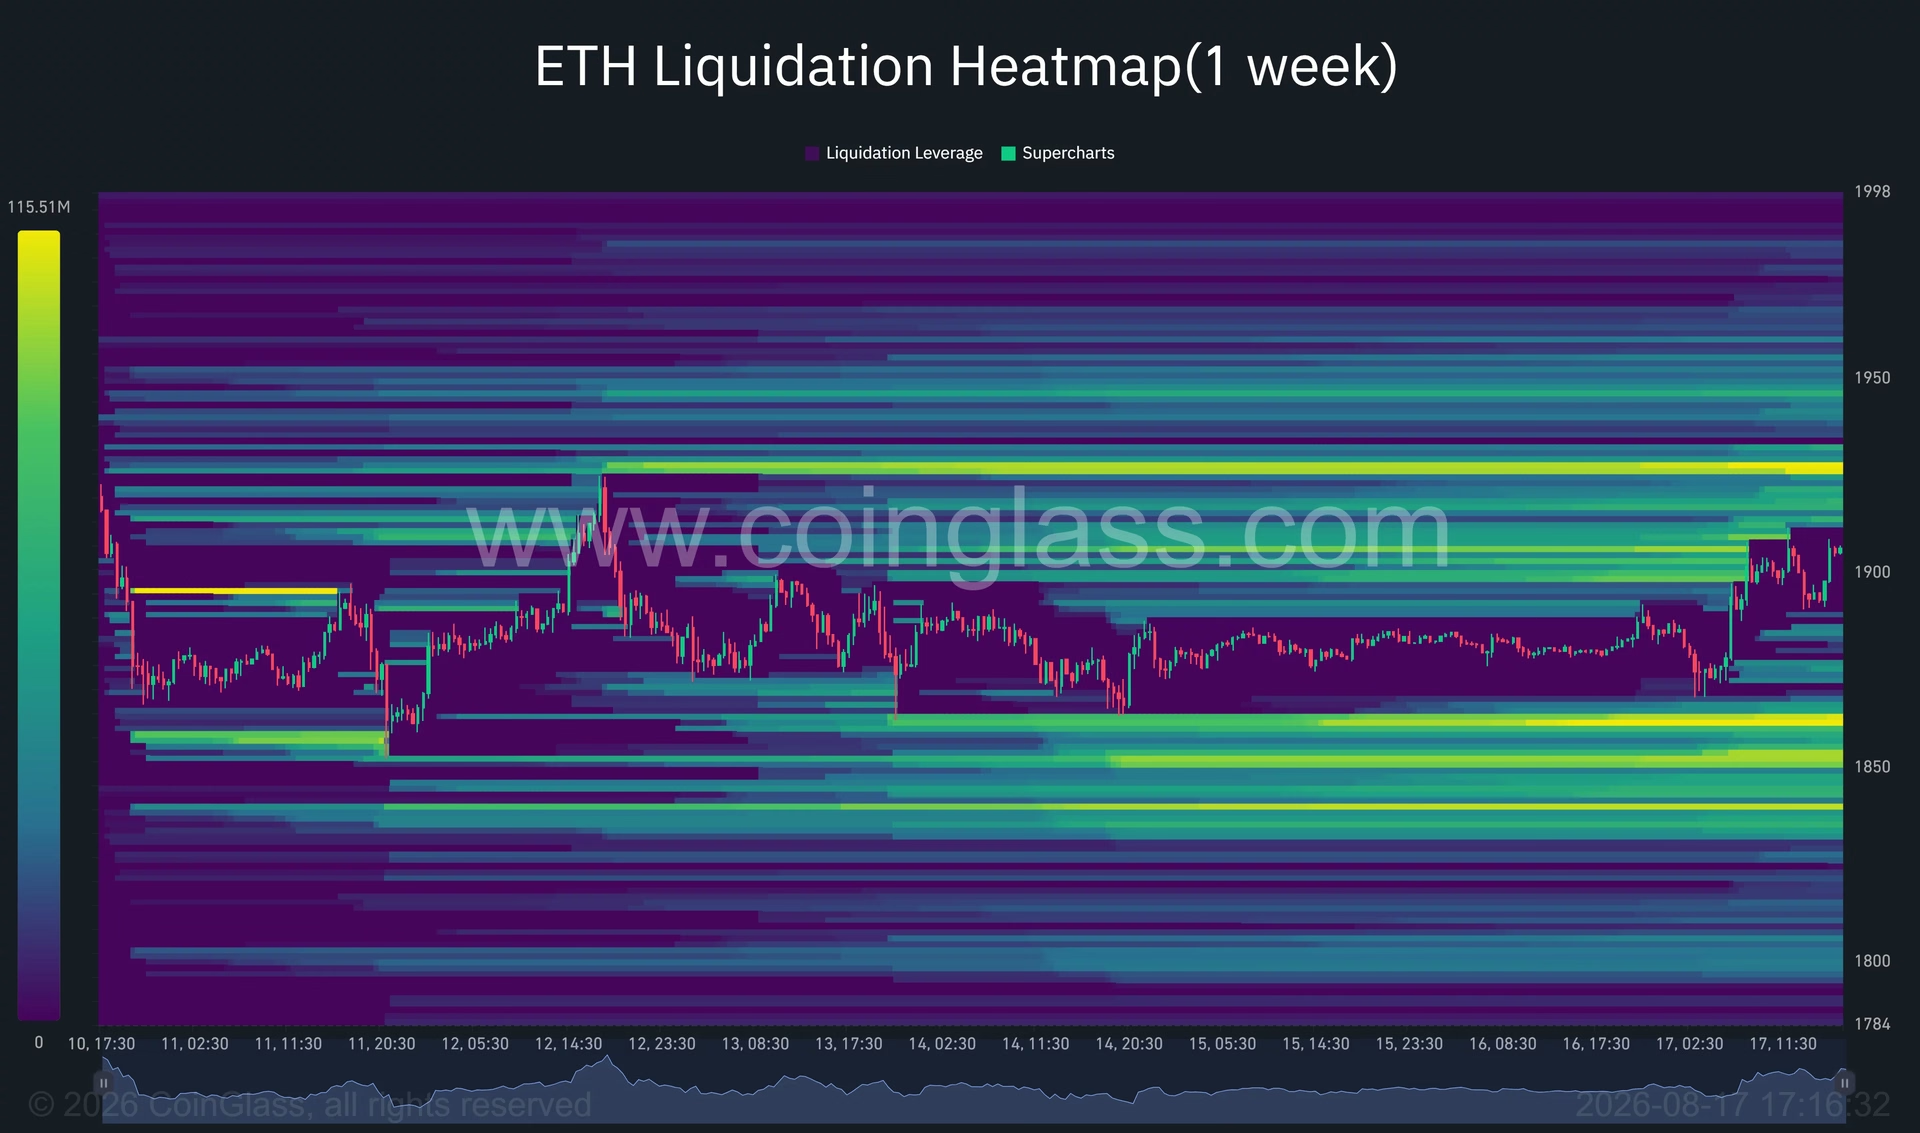
This $1,925 level represents the nearest meaningful target if Ethereum maintains its position above $1,900. A decisive move through this zone could trigger a cascade of short liquidations, generating additional buying pressure as traders covering short positions add market orders to the advance.
The next visible liquidity cluster appears near $1,945–$1,950, which conveniently aligns with the upper boundary of Ethereum's recent trading range. Breaking through this area would represent a genuine range breakout and could open the path toward the $1,960 level that technical analysts have identified as critical.
Analyst Perspectives on the $1,960 Target 🎯
Technical analysts tracking Ethereum have converged on $1,960 as the key level required for stronger upside momentum. Respected chart analysts identify the main breakout zone between approximately $1,945 and $1,960 as the critical area where Ethereum's medium-term direction will likely be determined.
A confirmed close above $1,960 could open the path toward $2,030, followed by a wider resistance area around $2,190. Notably, the $1,960 level sits close to the declining 200-day moving average, which could initially limit the initial breakout before resistance weakens at higher prices.
On the downside, structural support has been identified around $1,820. A break below this level would weaken the series of higher lows formed since June and could expose lower support near $1,713. However, current price action suggests this scenario remains unlikely in the near term.
Macroeconomic Headwinds to Monitor 🌍
Ethereum's recovery occurs against a backdrop of US macroeconomic uncertainty. Investors are carefully assessing whether inflation data will give the Federal Reserve room to loosen monetary policy. This is critical because higher Treasury yields and a stronger dollar reduce demand for risk assets—investors receive more attractive returns from government debt, making speculative assets like cryptocurrency less appealing.
Regulatory uncertainty also remains relevant to Ethereum's trajectory. While the regulatory environment has improved compared to 2022, questions persist about how governments will classify and regulate Ethereum staking, smart contracts, and decentralized finance applications. Clarity on these fronts could provide meaningful tailwinds for the token.
What's Next for Ethereum? 🚀
The current setup presents an interesting crossroads for Ethereum traders and investors. The 4-hour momentum is clearly bullish, with buyers defending support and pushing the token toward meaningful resistance levels. However, the daily chart's slightly negative Chaikin Money Flow reading suggests that institutional capital hasn't fully committed to the upside.
For Ethereum to stage a convincing breakout above $1,960, several conditions should align: sustained buying pressure that maintains the token above $1,925, positive macroeconomic developments that reduce risk-off sentiment, and ideally, additional large-scale institutional staking or deployment announcements.
The next 48–72 hours will likely prove decisive. If Ethereum can establish a confirmed close above $1,925 and maintain momentum, the path toward $1,960 becomes increasingly probable. Conversely, a failure to hold $1,900 would reopen the possibility of a pullback toward the $1,850–$1,870 support zone.
Key Takeaways 📌
- Current Momentum: Ethereum has rebounded nearly 2% to trade near $1,908, with 4-hour technicals showing genuine buyer interest
- Critical Resistance: The $1,960 level represents the key breakout target; breaking above $1,945–$1,950 would confirm a range breakout
- On-Chain Support: A $61.46 million whale deposit into staking contracts suggests institutional confidence
- Technical Caution: Daily chart metrics show selling pressure still exceeds buying pressure, indicating confirmation is needed
- Macro Risks: Federal Reserve policy and Treasury yields remain significant headwinds for risk assets
Ethereum's current position represents a genuine inflection point. The technical setup is encouraging, on-chain metrics are supportive, and the $1,960 breakout target is within reach. However, sustained momentum will require confirmation from capital flows and favorable macroeconomic conditions. Traders should monitor the $1,925 liquidity zone closely—a break above this level could accelerate the move toward $1,960 and beyond. ✨
You May Also Like

Market Analysis
XRP Price Falls 5% as Leverage Hits Seven-Month High
August 26, 2026

Market Analysis
Crypto Market Hits Extreme Greed: What This Means for Bitcoin
August 26, 2026

Market Analysis
Ethereum Price Rally Overheats Below $2,550 Resistance
August 26, 2026

Market Analysis
Hyperliquid Price Rally: HYPE Targets $97 Amid $80 Support
August 25, 2026