Category:
Market AnalysisEthereum Price Reclaims $1,900: Bulls Eye $2,000 Target

Ethereum has staged a compelling recovery to reclaim the $1,900 psychological level, reigniting optimism among traders about the cryptocurrency's near-term trajectory. 🚀 The second-largest blockchain by market capitalization has demonstrated resilience through aggressive spot buying and short liquidations, signaling that bulls remain firmly in control despite facing persistent resistance barriers.
The question on every trader's mind: can Ethereum finally break through the $2,000 ceiling that has eluded it for weeks? Understanding the technical setup, liquidation dynamics, and broader market conditions is essential for anyone monitoring this pivotal moment in ETH's price action.
Ethereum's Recovery Momentum: Breaking Above $1,900 ✨
Ethereum was trading near $1,908 at the time of this analysis, having bounced from an intraday low around $1,895. This move represents a significant psychological victory, as the $1,900 level has served as a crucial battleground between bulls and bears throughout the consolidation phase.
The recovery wasn't accidental—it was driven by genuine buying pressure and forced liquidations of short positions. When traders betting on lower prices are forced to cover their positions, it creates a cascade of buy orders that accelerates price movements upward. This liquidation-driven dynamic has become increasingly important in crypto markets where leverage is prevalent.
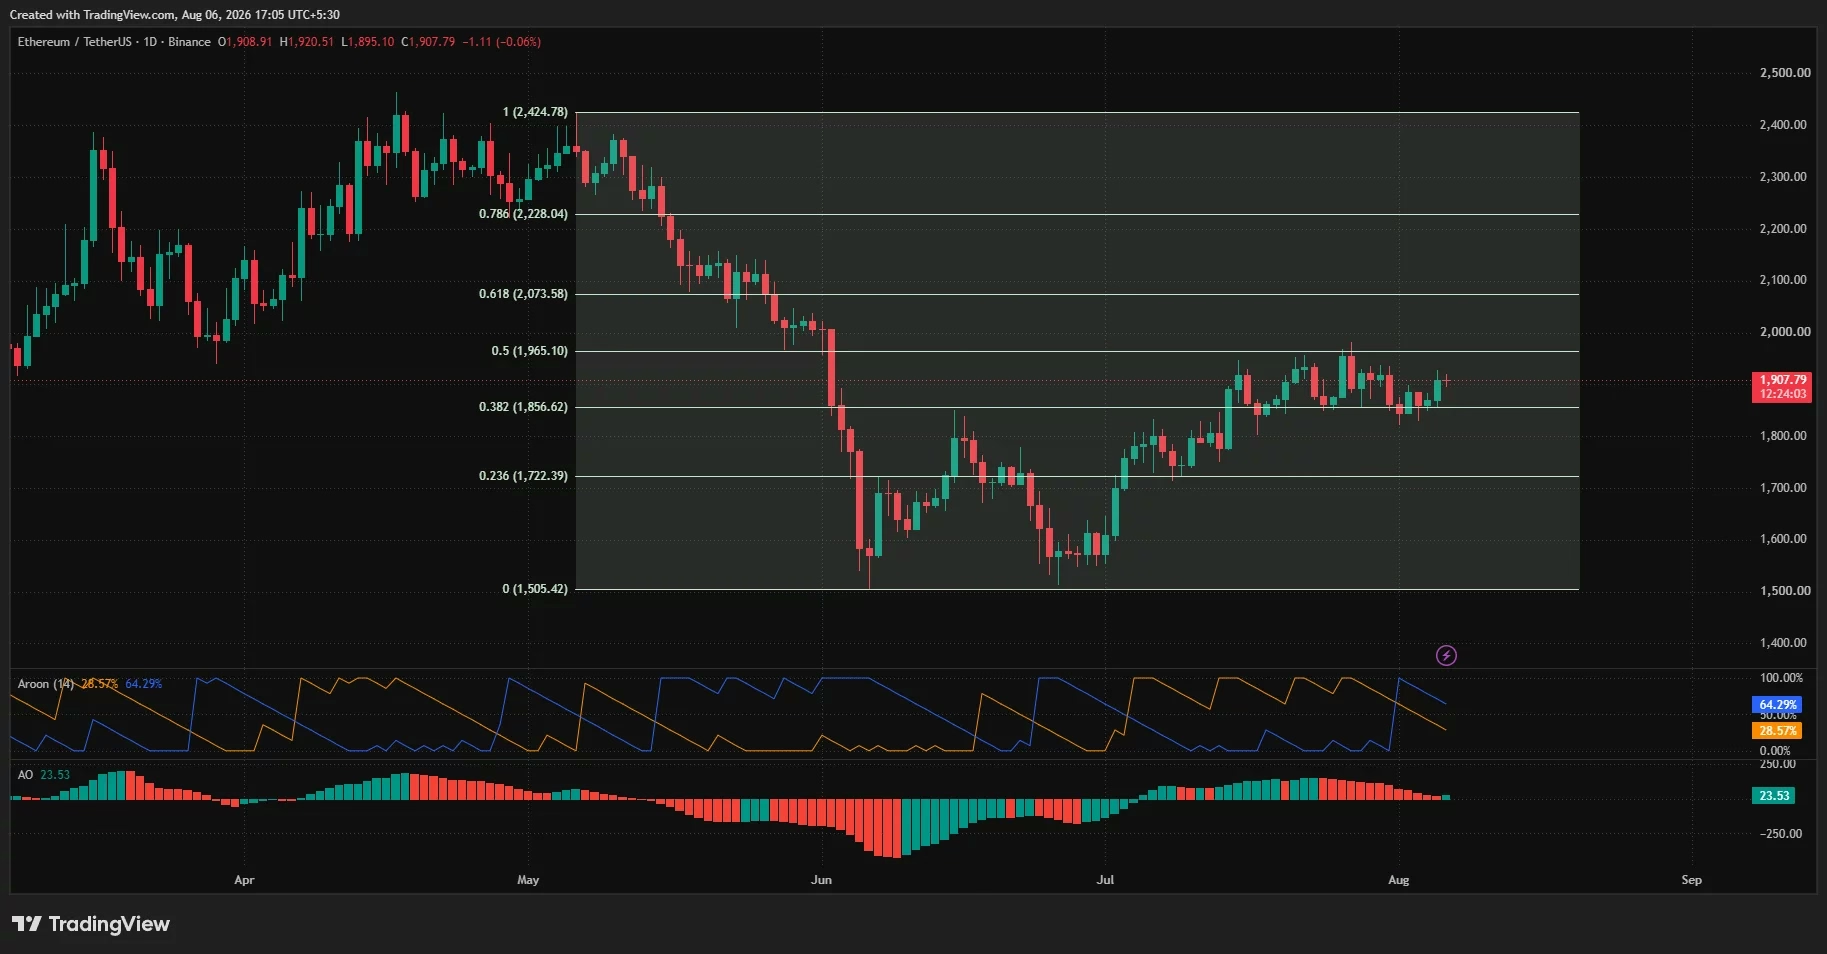
Since mid-July, Ethereum has established a robust support foundation at the 38.2% Fibonacci retracement level of $1,856.62, calculated from the June low of $1,505.42 to the April peak of $2,424.78. The consistent defense of this level demonstrates that buyers remain actively engaged on pullbacks, refusing to allow the price to collapse further.
However, this same period has revealed a concerning pattern: repeated rejection from resistance in the $1,920–$1,965 zone. Ethereum has tested this area multiple times without achieving a decisive breakout, creating what technical analysts call a "consolidation range." 📊
The Technical Picture: Indicators Show Mixed Signals 🔍
While Ethereum's price action appears constructive on the surface, the technical indicators reveal a more nuanced story. The daily Aroon indicator continues to favor buyers, with Aroon Up reading at 64.29% compared to Aroon Down at 28.57%. This divergence suggests that recent highs remain more relevant to the current trend than recent lows, supporting the broader recovery narrative.
The Awesome Oscillator also trades in positive territory at 23.53, indicating that short-term momentum remains stronger than longer-term momentum. However—and this is crucial—the oscillator's green bars have begun to contract noticeably. This contraction signals that bullish momentum is losing steam as Ethereum approaches significant resistance levels.
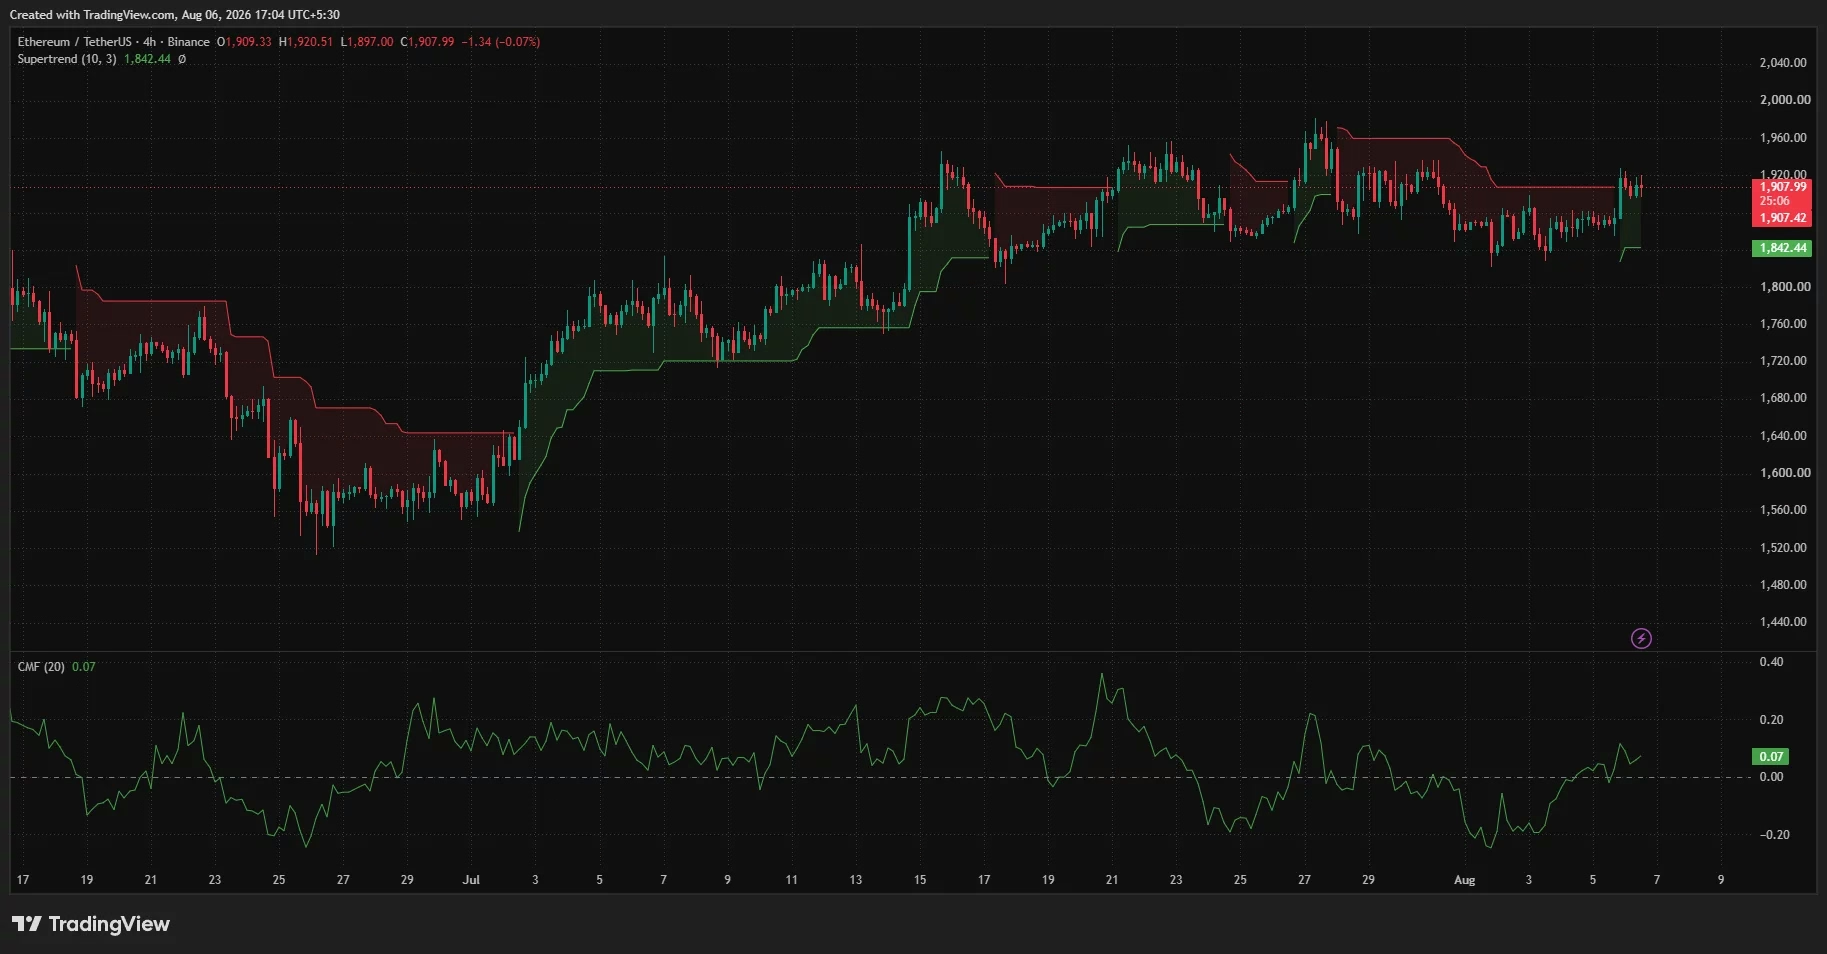
On the 4-hour timeframe, the picture appears more encouraging. Ethereum remains comfortably above the Supertrend support at $1,842.44, with the indicator maintaining its bullish signal. The Chaikin Money Flow metric has returned above the zero line at 0.07, pointing to modest net buying pressure, though not yet at overwhelming levels.
The consensus from technical analysis: bulls retain control of the short-term structure, but the market hasn't generated sufficient momentum for a clean break through the $1,965 barrier. 💪
Liquidation Clusters: The Hidden Catalyst for Breakouts 🌟
One of the most overlooked aspects of modern cryptocurrency price analysis is the role of liquidation clusters—concentrations of leveraged positions that, when triggered, can dramatically accelerate price movements. Understanding where these clusters sit relative to current price levels is essential for predicting the next major move.
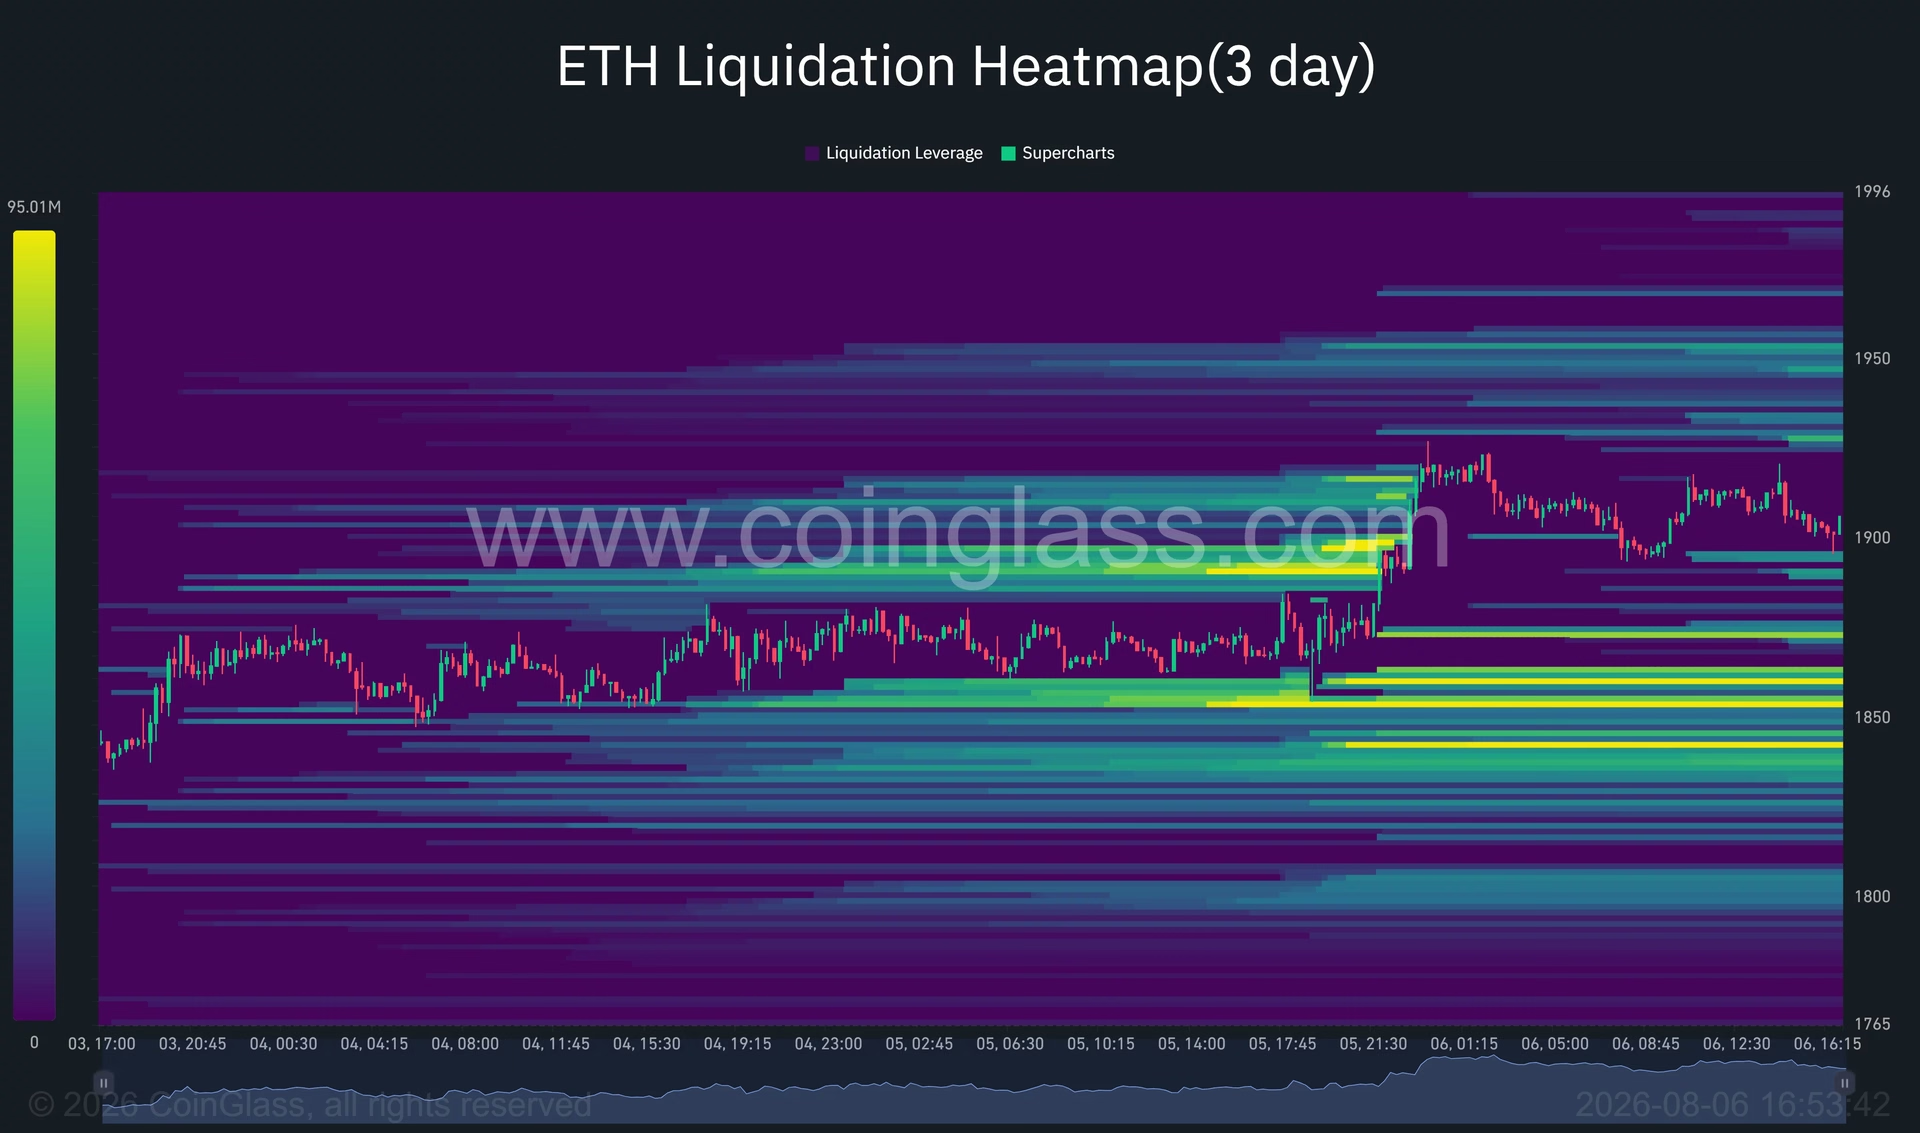
The 3-day liquidation heatmap reveals several critical zones surrounding Ethereum's current price:
Upside Liquidation Zones:
- $1,925–$1,950 range: This represents the most significant upside liquidity cluster. A move into this zone would force short sellers to close positions, creating a cascade of buy orders that could accelerate Ethereum toward $1,965
- Fibonacci confluence: The $1,950–$1,965 area represents the 50% Fibonacci retracement on the daily chart, adding technical weight to this already important zone
- Psychological significance: This range sits directly below the $2,000 target, making it the ultimate test for bullish momentum
Downside Liquidation Zones:
- $1,870 level: Represents the first significant downside cluster
- $1,850–$1,860 zone: Contains sizable liquidation concentrations
- Critical support at $1,856: This level combines Fibonacci support with dense liquidation clustering, making it exceptionally important for the recovery thesis
If Ethereum loses the $1,900 support and drops into these downside zones, it could trigger a cascade of liquidations that extend the decline toward $1,842 or even $1,800. Conversely, a decisive move through the upside clusters could accelerate the advance toward $2,000 and beyond. 🎯
The Path to $2,000: Three Critical Conditions 🔑
Market analysts have identified three essential conditions that must be met for Ethereum to successfully challenge the $2,000 level:
1. Holding $1,900 Support Ethereum must maintain its position above this psychological level. Failure to do so would invalidate the immediate recovery narrative and expose lower support levels. This is the baseline requirement for any move higher.
2. Clearing the Liquidation Clusters ($1,925–$1,950) Breaking through the short-liquidation zone between $1,925 and $1,950 is essential. A move into this region would force short sellers to cover positions, potentially creating the momentum needed for the next leg higher.
3. Breaking Through $1,965 Fibonacci Resistance A daily or 4-hour close above $1,965 would provide stronger confirmation that buyers can genuinely test $2,000. Until this level is decisively broken, Ethereum remains trapped in a resistance zone that has already rejected multiple advances since mid-July.
If all three conditions are met, the path to $2,000 opens considerably. Beyond that psychological barrier, the next Fibonacci resistance sits at $2,073.58, which could attract significant selling pressure from traders taking profits. 📈
Macro Factors: Fed Policy and Risk Sentiment 🌐
Ethereum's price action doesn't exist in a vacuum. The cryptocurrency remains highly sensitive to broader financial market dynamics, particularly U.S. equity markets and Federal Reserve policy expectations.
Technology stocks on Wall Street have historically moved in tandem with Ethereum, as both are considered speculative assets. If equity sentiment improves, it typically supports another ETH breakout. Conversely, if risk appetite deteriorates—perhaps due to shifting expectations about the Fed's September meeting—speculative assets like Ethereum could face headwinds.
The current macroeconomic environment suggests cautious optimism. While inflation remains a concern, recent economic data has been mixed, keeping Fed policy expectations in flux. This uncertainty could benefit Ethereum if traders perceive it as a hedge against traditional financial volatility. ⚖️
What Could Derail the Bullish Thesis? ⚠️
While the setup appears favorable for bulls, several scenarios could invalidate the immediate $2,000 target:
- Failure to hold $1,900: A close below this level would suggest bulls lack conviction and could accelerate selling
- Weakness at $1,965: Rejection from this Fibonacci level for a fourth or fifth time could discourage buyers and trigger profit-taking
- Liquidation cascade below $1,856: Losing this critical support would extend the decline toward $1,842 and potentially $1,800
- Macro deterioration: Negative news from the Federal Reserve or weakness in tech stocks could undermine the recovery
The Bottom Line: A Critical Juncture 🎬
Ethereum stands at a critical juncture. The reclamation of $1,900 represents a genuine recovery attempt, but the technical setup remains conditional. Bulls must demonstrate their commitment by breaking through the liquidation clusters at $1,925–$1,950 and the Fibonacci resistance at $1,965.
If these conditions are met, $2,000 becomes an achievable target in the near term. However, traders should remain vigilant about the warning signs of weakening momentum. The contracting bars on the Awesome Oscillator suggest that buying pressure is not overwhelming, meaning Ethereum could face another rejection before finally breaking higher.
For now, $1,900 serves as the line in the sand. Hold it, and the path to $2,000 remains open. Lose it, and the recovery thesis comes into question. The next few trading sessions will be crucial in determining which scenario unfolds. 💫
You May Also Like

Market Analysis
XRP Price Falls 5% as Leverage Hits Seven-Month High
August 26, 2026

Market Analysis
Crypto Market Hits Extreme Greed: What This Means for Bitcoin
August 26, 2026

Market Analysis
Ethereum Price Rally Overheats Below $2,550 Resistance
August 26, 2026

Market Analysis
Hyperliquid Price Rally: HYPE Targets $97 Amid $80 Support
August 25, 2026