Category:
Market AnalysisEthereum Price Slips to $1,875: Breaking Down the $1,900 Resistance

Ethereum Faces Rejection at $1,900 Resistance Level 🔴
Ethereum has encountered significant headwinds as it attempts to establish momentum above the critical $1,900 psychological barrier. Currently trading near $1,875, the second-largest cryptocurrency by market capitalization is experiencing the kind of price pressure that has become all too familiar throughout August. This struggle to break through represents more than just a technical setback—it reflects the broader tension between bullish momentum and profit-taking behavior that's characterizing the current market cycle.
The repeated rejection at $1,900 tells an important story about market sentiment. Each time ETH approaches this level, sellers emerge with sufficient conviction to push price back down into the $1,870–$1,890 range. This pattern has created a compressed trading zone that limits both upside potential and downside risk, leaving traders and investors in a state of cautious uncertainty.
Understanding the Technical Breakdown 📊
The daily chart reveals a concerning picture for bullish traders. Ethereum's relative strength index (RSI) has fallen to 49.72, dipping below both its signal average of 52.55 and the neutral 50 level. This reading suggests that selling pressure has gained a slight edge, though the market hasn't yet entered deeply oversold territory.
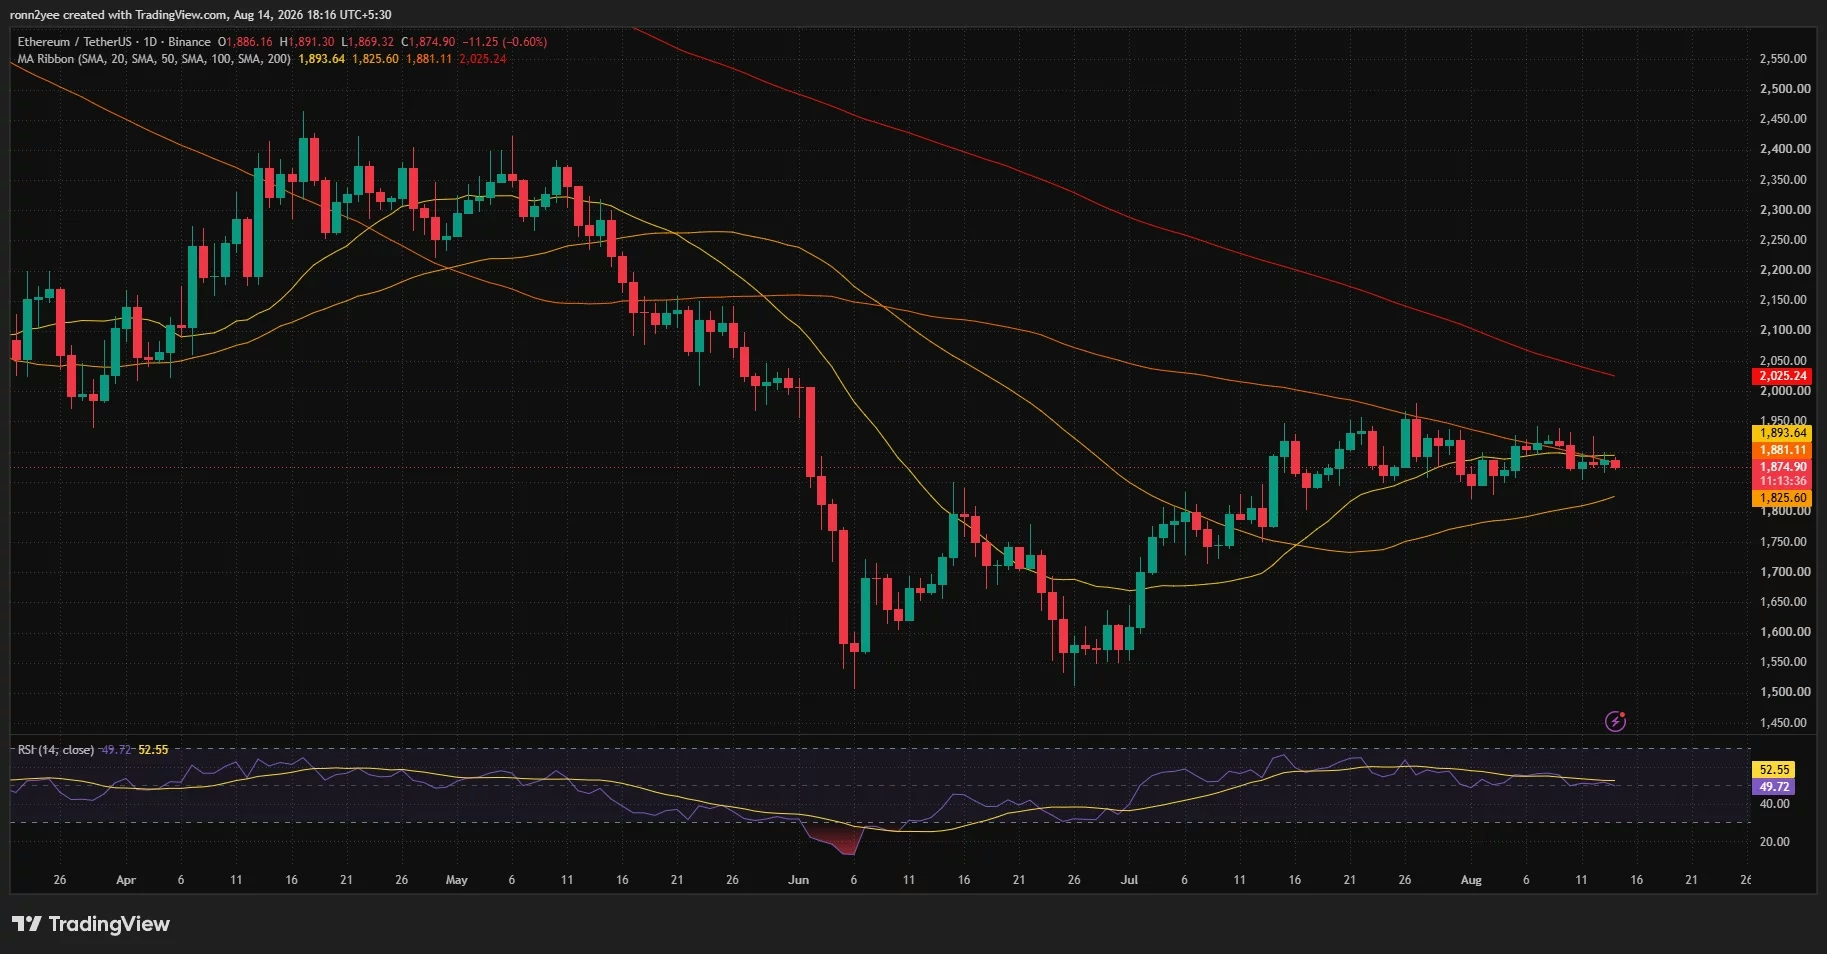
Moreover, Ethereum is currently trading beneath both its 20-day simple moving average ($1,881.11) and its 50-day average ($1,893.64). These key technical indicators have transformed into immediate resistance zones, creating a headwind for any attempted rallies. The fact that recent rebounds have consistently stalled around these averages suggests that short-term momentum remains compromised.
What's particularly noteworthy is that Ethereum remains above its 100-day moving average at $1,825.60, which means the medium-term recovery from the June lows near $1,550 is still technically intact. However, this cushion is narrowing, and losing the $1,850 support level would bring the 100-day average into much closer proximity.
The Liquidation Landscape: Where the Real Action Lies 🎯
One of the most revealing aspects of the current market structure involves the distribution of leveraged positions. The liquidation heatmap paints a picture of competing interests that could determine Ethereum's next major move.
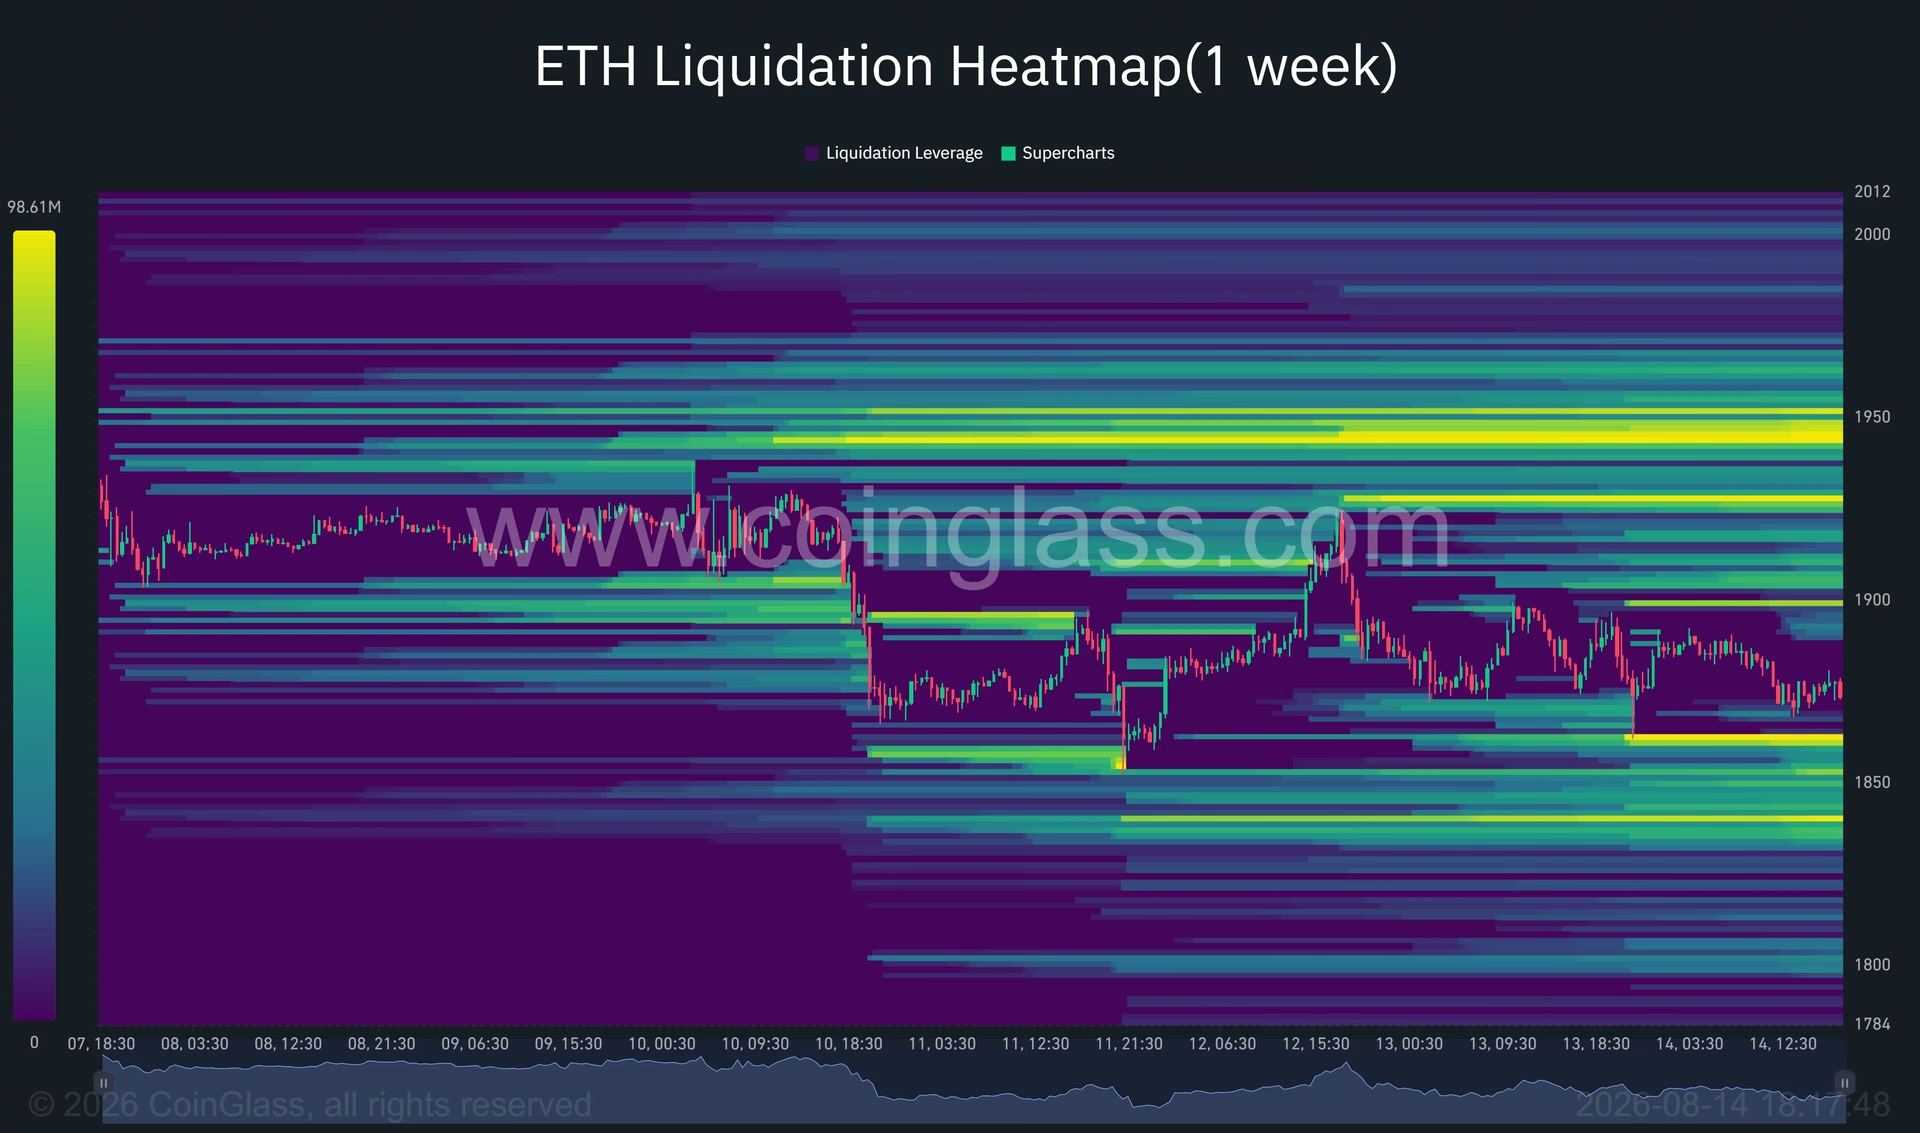
On the upside, the densest concentration of liquidation liquidity sits in the $1,940–$1,950 zone, with another notable cluster around $1,925. These areas represent roughly $65–$75 above the current price, creating a meaningful hurdle for bulls to overcome. If Ethereum were to break decisively above $1,900 and push toward these zones, short sellers would face forced liquidations, potentially creating a cascade of buying pressure.
Conversely, the downside liquidation picture is equally important. Active liquidity clusters exist near $1,855–$1,860, with a larger band concentrated around $1,835–$1,845. What's particularly concerning is that the closest downside liquidation cluster sits within roughly $20 of the current price. This proximity means that any breakdown below $1,850 could trigger long liquidations and accelerate selling toward $1,840.
This bifurcated liquidation structure essentially traps Ethereum between two competing pools of leveraged positions, creating a scenario where volatility could spike in either direction without warning.
Moving Average Resistance and the Bigger Picture 📈
The technical setup extends beyond short-term indicators. Ethereum's 200-day moving average sits at $2,025.24, substantially above the current price. This elevated level underscores that the larger downtrend initiated after the April and May highs above $2,300 has not yet reversed. While the recovery from June lows has been respectable, Ethereum still faces a considerable distance to reclaim the broader uptrend.
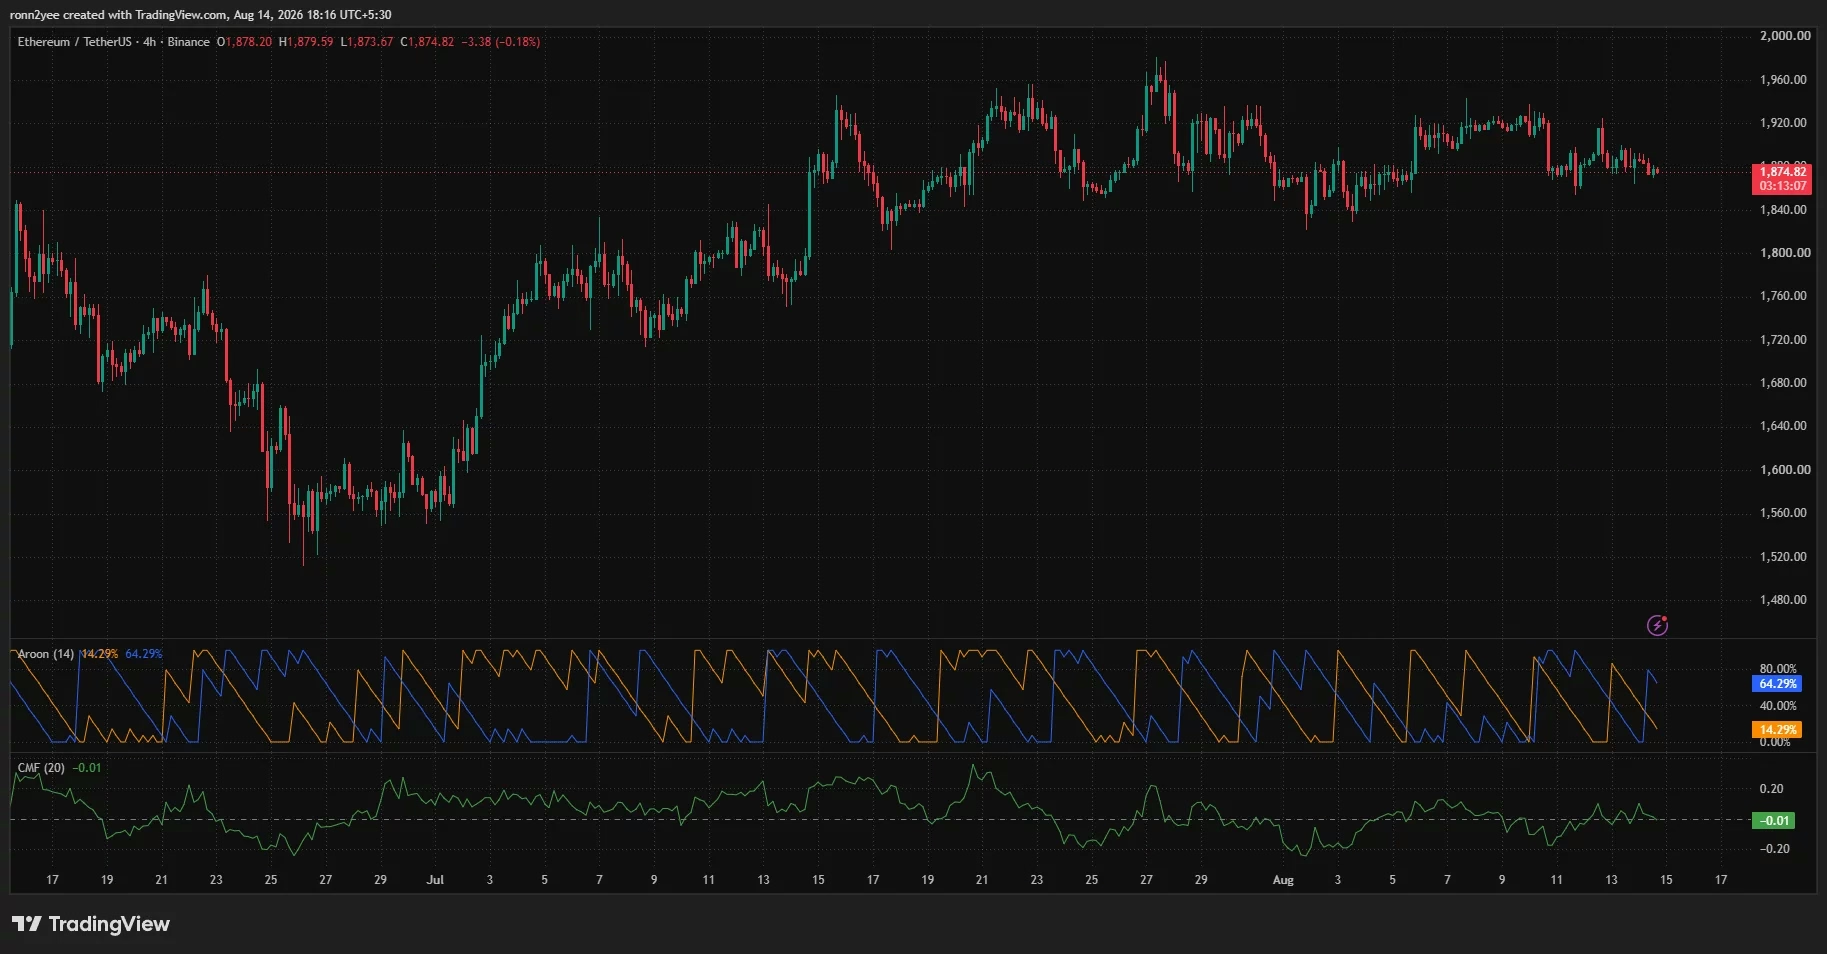
The 4-hour chart provides additional nuance to this narrative. The Aroon Up indicator registered 64.29% compared to Aroon Down at 14.29%, suggesting that the recent rebound structure hasn't completely dissipated. However, price action has yet to confirm renewed upside strength, leaving the door open for either consolidation or a retest of lower support.
Chaikin Money Flow stands at minus 0.01, indicating that buying and selling pressure are nearly balanced with only a marginal advantage for sellers. This near-equilibrium reading suggests that Ethereum lacks the sustained inflows necessary for a decisive breakout in either direction.
Expert Analysis: The $1,850 Must-Hold Level 💡
Crypto analysts have been vocal about the significance of certain price levels. The $1,850 support zone has emerged as what many describe as a "must-hold" level if Ethereum is to preserve its recent gains and maintain the recovery structure established since late June.
According to technical analysis from leading market observers, the first upside barrier sits around $1,955, followed by more substantial resistance at $2,050 and $2,190. On the downside, a sustained break below $1,850 could expose support around $1,700 before reaching the larger support region near $1,550.
These levels align closely with the daily chart structure, where the 100-day moving average provides a safety net at approximately $1,826. A decisive breakdown through both $1,850 and this longer-term average would represent a significant weakening of the recovery structure.
ETH/BTC Dynamics: A Relative Strength Story 🔄
It's worth noting that Ethereum has been gaining ground against Bitcoin recently, approaching the 0.03 level on the ETH/BTC trading pair. This relative strength suggests that altcoins are beginning to outperform Bitcoin during this consolidation phase. While this development is encouraging for Ethereum bulls, it doesn't automatically resolve the dollar-denominated resistance at $1,900.
The relative trend remains clear as Bitcoin consolidates and altcoins perform with greater vigor. However, Ethereum must still reclaim $1,900 and clear the dense $1,925–$1,950 liquidity area before its short-term structure becomes more constructive.
ETF Inflows: Institutional Support Continues 📈
On a more positive note, U.S. spot Ethereum exchange-traded funds have been attracting consistent capital inflows. During the Aug. 3–7 trading week, these funds recorded $245 million in net inflows, extending their positive streak to five consecutive weeks. This institutional demand provides a meaningful floor beneath the market and suggests that longer-term investors remain committed to Ethereum exposure.
However, these ETF inflows, while supportive, have not been sufficient to force a decisive breakout above $1,900. This disconnect between institutional demand and price action suggests that near-term technical resistance remains formidable.
What Happens Next: Key Scenarios to Watch 🔮
Ethereum's immediate future hinges on whether bulls can reclaim and hold the $1,900 level. A successful close above this psychological barrier would open a path toward the $1,925 zone, followed by the heavily concentrated $1,940–$1,950 liquidation cluster. Such a move could accelerate quickly if short sellers are forced to cover positions.
Conversely, a breakdown below $1,850 would represent a significant technical failure and could trigger long liquidations, potentially carrying Ethereum toward $1,840 and beyond. The proximity of downside liquidation clusters means that any such move could gather momentum rapidly.
The most likely near-term scenario involves continued consolidation within the $1,850–$1,900 range. This sideways action would allow time for technical indicators to reset and for market participants to build conviction in either direction.
Key Takeaways for Ethereum Investors 🎬
Ethereum's struggle at $1,900 reflects the broader market dynamics of profit-taking and technical resistance. The $1,850 support level remains critical—losing it would weaken the medium-term recovery structure. Institutional support via spot ETF inflows provides a positive undercurrent, but near-term technical resistance remains formidable.
Traders should monitor the liquidation clusters closely, as they represent the most likely inflection points for significant price moves. The balance between competing pools of leveraged positions creates a scenario where volatility could spike without warning. Until Ethereum definitively breaks above $1,900 and clears the $1,925–$1,950 resistance zone, the technical setup remains neutral-to-weak despite the longer-term recovery trajectory from June lows.
You May Also Like

Market Analysis
XRP Price Falls 5% as Leverage Hits Seven-Month High
August 26, 2026

Market Analysis
Crypto Market Hits Extreme Greed: What This Means for Bitcoin
August 26, 2026

Market Analysis
Ethereum Price Rally Overheats Below $2,550 Resistance
August 26, 2026

Market Analysis
Hyperliquid Price Rally: HYPE Targets $97 Amid $80 Support
August 25, 2026