Category:
Market AnalysisEthereum Price Stalls Below $1,875: US Demand Lags

Ethereum's recent price action tells a story of consolidation and caution. 📊 Trading near $1,867, the second-largest cryptocurrency finds itself trapped in a narrow range as institutional and retail buyers from the United States remain conspicuously absent from the market. This technical stagnation raises important questions about whether ETH can break through its current resistance levels or if weakness will persist in the coming weeks.
The broader context matters here: Ethereum recovered impressively from its June lows near $1,500, demonstrating underlying strength in the digital asset. However, momentum has visibly deteriorated after the token failed to decisively break through the psychologically important $1,950–$2,000 zone during late July. That failure to sustain higher prices has left traders cautious and positioned for potential downside protection.
Understanding Ethereum's Technical Resistance Zones 🎯
Ethereum's current price action is best understood through the lens of multiple overlapping technical levels. The $1,875 Murrey Math level represents the bottom boundary of the token's established daily trading range. This isn't merely a random number—it's a level that buyers have tested repeatedly since mid-July without successfully converting it into sustained support.
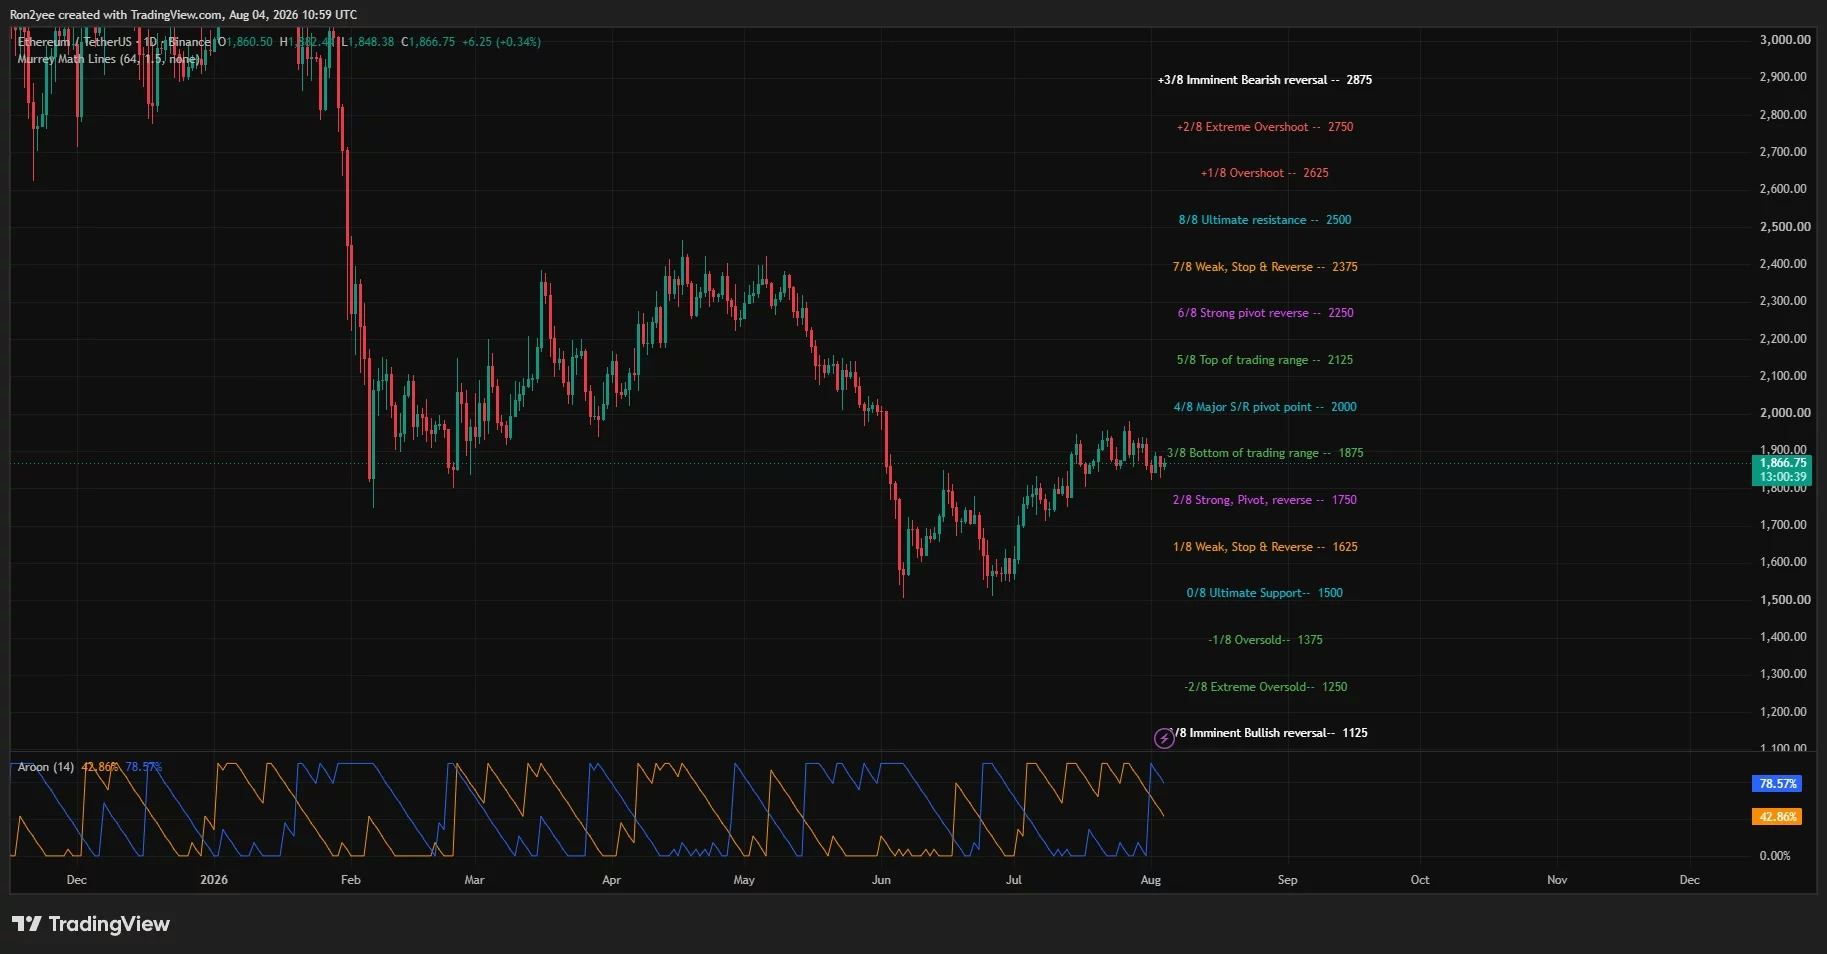
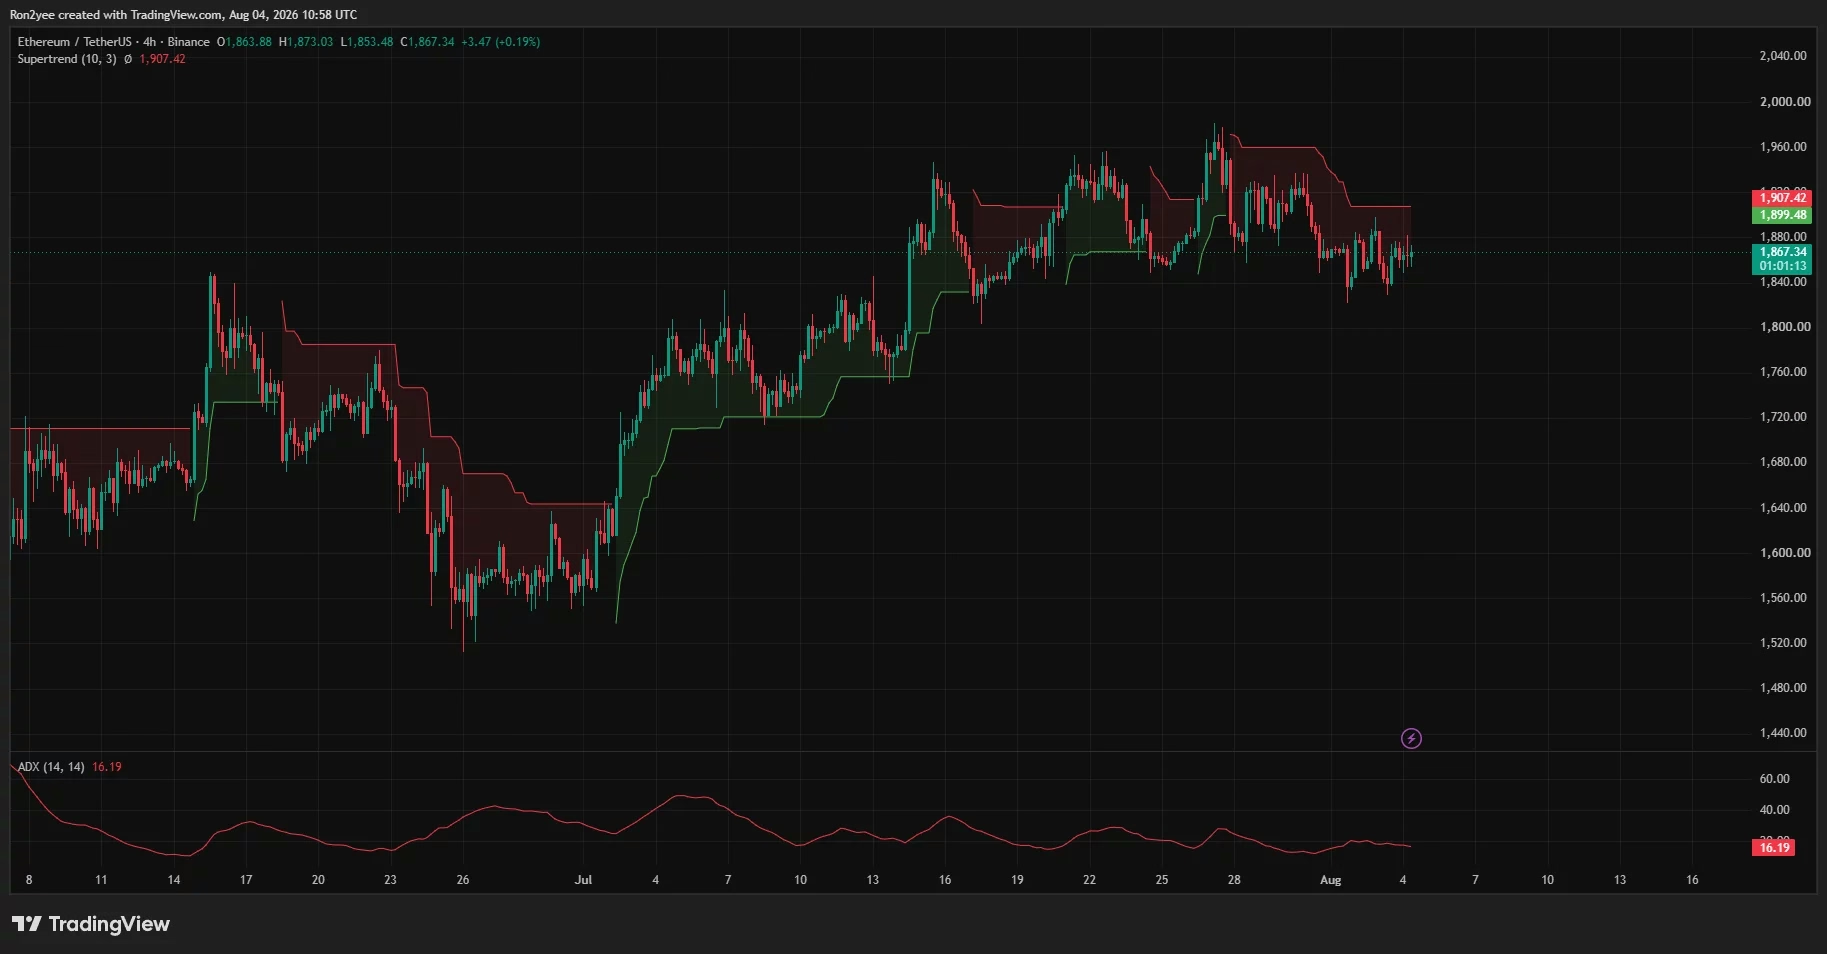
On the 4-hour timeframe, the Supertrend indicator places resistance at $1,907, a level that Ethereum must convincingly break above to signal renewed bullish momentum. The fact that ETH continues to trade below this threshold suggests that short-term sellers maintain control of price discovery. The Average Directional Index (ADX), which measures trend strength, stood at 16.19—well below the 20 threshold that typically indicates a meaningful directional trend.
This weak ADX reading is particularly telling. It suggests that neither buyers nor sellers currently possess sufficient conviction to drive a decisive move. Instead, traders should anticipate continued consolidation between approximately $1,840 and $1,900 until volume surges and breaks this equilibrium.
The path to higher prices runs through $1,907 initially, followed by the $1,940 level and the late-July highs near $1,970. A daily close above $2,000—the psychological and technical pivot point—would open the door toward $2,125 and represent a meaningful shift in market sentiment.
The Liquidation Heatmap: Where the Real Action Could Happen 🔥
One of the most revealing indicators for short-term price targets comes from analyzing where leveraged positions are concentrated. CoinGlass's one-week liquidation heatmap shows a striking concentration of short liquidations clustered around $1,935–$1,945.
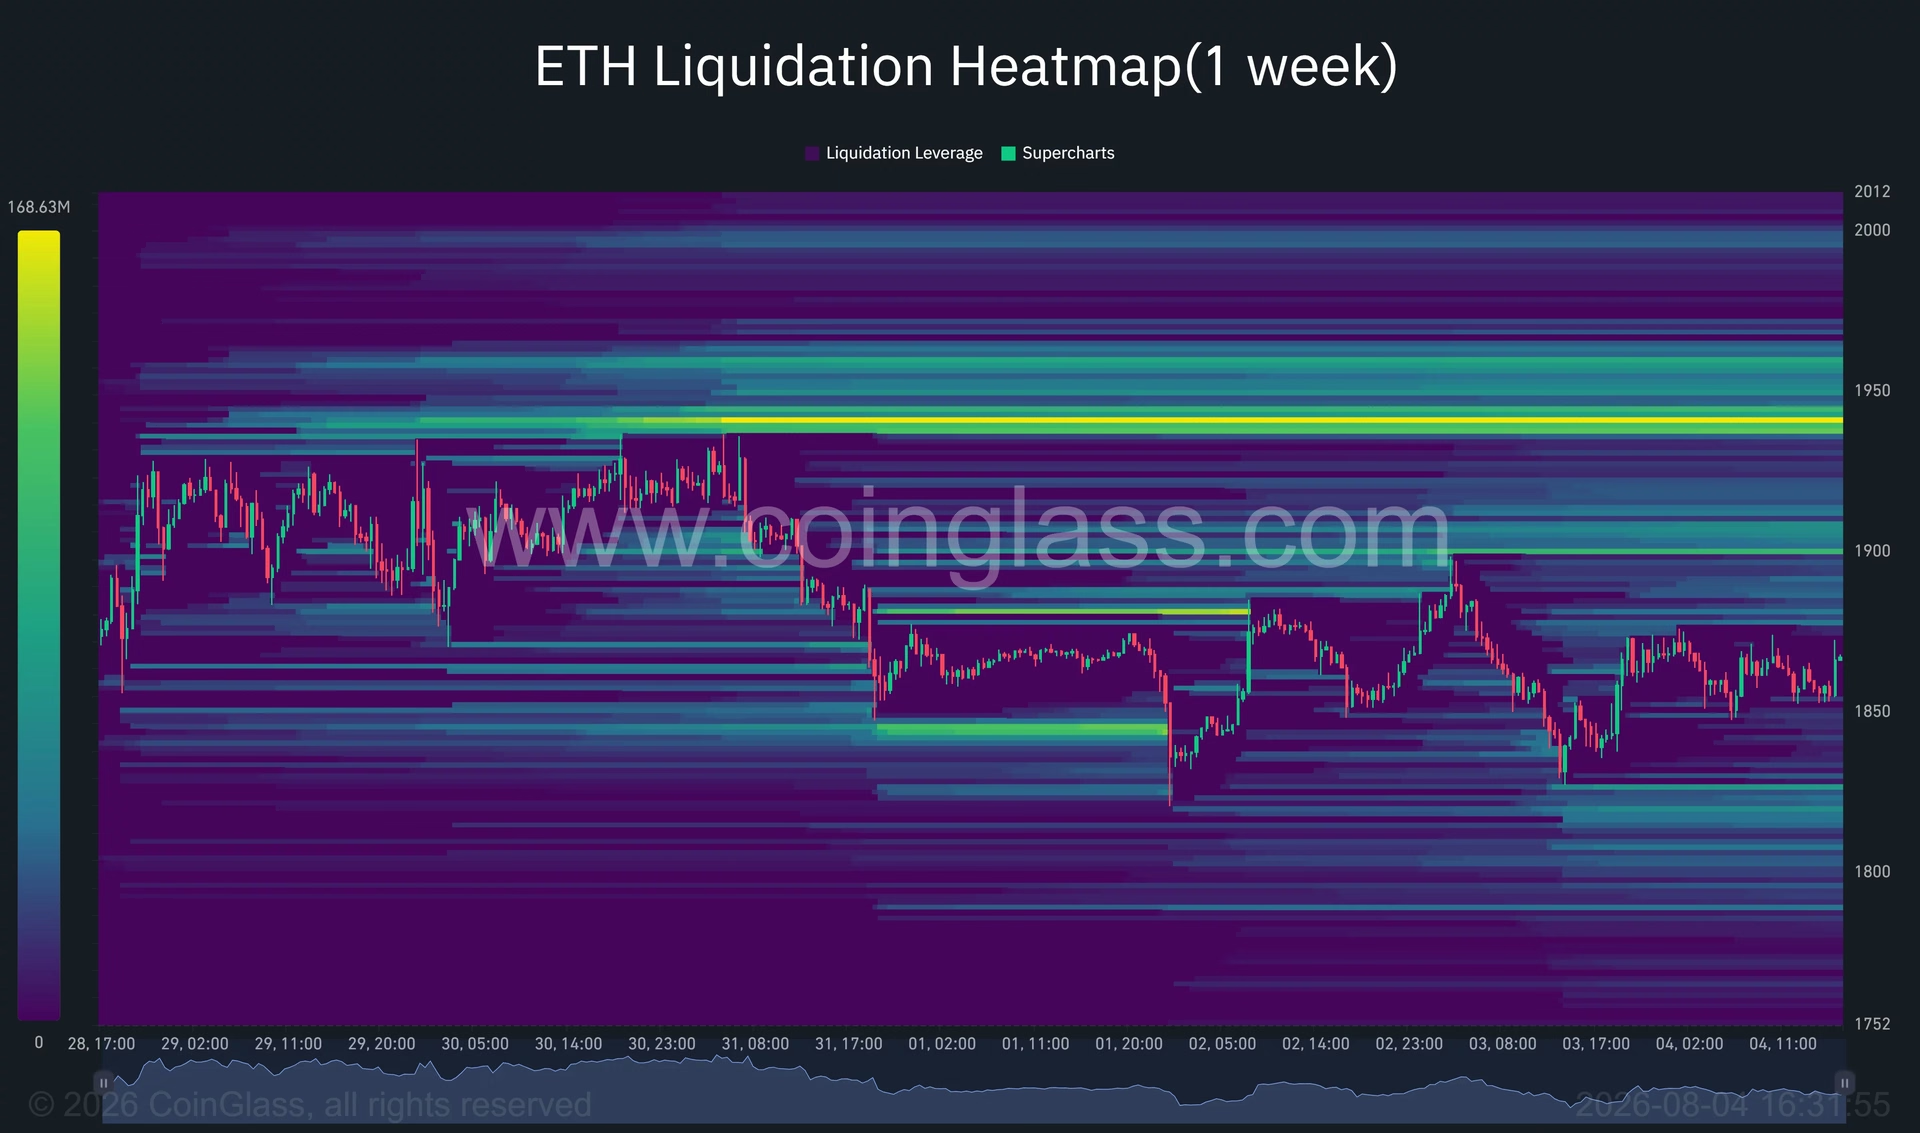
This matters significantly because these liquidation zones often become magnets for price action during trending moves. When a price level contains dense layers of liquidated positions, it can accelerate moves as forced short covering combines with spot demand. Additional liquidation clusters appear around $1,955–$1,970 and near the $2,000 psychological level.
On the downside, liquidation support is less concentrated but still meaningful. The $1,820 and $1,800 levels represent areas where long positions could face pressure if Ethereum breaks below the $1,840 support level. Understanding these zones helps traders anticipate volatility and potential acceleration points.
The liquidation map doesn't predict which level ETH will reach first—it simply highlights where forced liquidations could amplify price movements once direction becomes clear.
US Demand Weakness: The Real Headwind ⚠️
Perhaps the most concerning factor for Ethereum bulls is the weakness in US-based demand. The Coinbase Premium Index, which measures the price difference between Ethereum on Coinbase (serving primarily US customers) versus other major exchanges, stood at approximately -0.083. A negative premium indicates that ETH was trading at a discount on Coinbase compared to global markets.
This negative reading sends a clear signal: American investors and institutions are not aggressively accumulating Ethereum at current prices. Instead, global demand appears stronger, suggesting that international traders remain more bullish than their US counterparts.
This demand divergence coincides with several headwinds specific to the American market:
- ETF inflows have slowed significantly after an initial period of strong institutional adoption through spot Ethereum ETFs
- Stablecoin liquidity has weakened considerably, with Binance net inflows falling 518% week-over-week
- Federal Reserve policy uncertainty continues to weigh on institutional positioning across digital assets
- Stalled crypto legislation, particularly around the CLARITY Act, has left regulatory clarity in limbo
These factors combine to create a defensive posture among sophisticated US investors. Until the Coinbase Premium Index returns to positive territory, indicating renewed American buyer enthusiasm, Ethereum will likely remain dependent on offshore exchange demand and global capital flows.
The Downside Risks Worth Monitoring 📉
While bulls point to Ethereum's recovery from June lows as evidence of underlying strength, bears have legitimate reasons for caution. If the $1,840 support level fails to hold during a sustained selloff, ETH could quickly test the early-August low around $1,825.
Further deterioration would expose the stronger daily pivot at $1,750, which represents a more meaningful support level from a longer-term perspective. A break below $1,800 would signal that the broader recovery structure has been compromised and could attract additional selling pressure from position liquidations.
The key to avoiding downside scenarios involves a decisive break above $1,907 accompanied by improving volume metrics. Without these confirmations, the risk remains skewed toward continued consolidation or mild weakness.
ETH/BTC Strength: A Bullish Counterpoint ✨
Amidst dollar-denominated weakness, Ethereum shows interesting relative strength against Bitcoin. The ETH/BTC trading pair remains in what technical analysts describe as a "solid uptrend," suggesting that even as Ethereum struggles in dollar terms, it's gaining ground against the leading cryptocurrency.
This relative strength could become strategically important if capital begins rotating from Bitcoin into larger altcoins during a risk-on market environment. However, this strength hasn't yet translated into meaningful USD price appreciation, highlighting the complexity of current market dynamics.
For Ethereum's dollar chart to confirm renewed upside momentum, the token must first reclaim $1,907, clear the $1,940 liquidation zone, and establish a daily close above $2,000. Until that sequence plays out, relative strength against Bitcoin remains more theoretical than practical for most traders.
What Ethereum Traders Should Watch 👀
The next few trading sessions will be critical for determining whether Ethereum can escape its current consolidation or if weakness will accelerate. Key levels to monitor include:
Resistance Levels (Bullish Targets):
- $1,907 (4-hour Supertrend)
- $1,935–$1,945 (Major liquidation cluster)
- $1,970 (Late-July highs)
- $2,000 (Psychological pivot)
- $2,125 (Next Murrey Math resistance)
Support Levels (Bearish Targets):
- $1,840 (Range bottom)
- $1,825 (Early-August low)
- $1,800 (Secondary support)
- $1,750 (Stronger daily pivot)
Volume confirmation will be essential. A move outside the $1,840–$1,900 consolidation range accompanied by strong volume would provide traders with genuine directional clarity. Without such confirmation, expect continued choppy, sideways price action.
The Broader Market Context 🌍
Ethereum's struggles aren't occurring in isolation. The broader digital asset market remains influenced by macro factors including Federal Reserve policy expectations, geopolitical developments, and evolving regulatory frameworks. The stalled CLARITY Act in the Senate represents just one example of how legislative uncertainty can dampen institutional enthusiasm.
International investors appear more confident than their American counterparts, suggesting that geographic demand dynamics are playing an outsized role in current price action. As US institutional positioning becomes more defensive, offshore exchanges carry disproportionate influence over Ethereum's price discovery.
Looking Ahead: What Could Change the Narrative 🚀
Several developments could shift Ethereum's trajectory in coming weeks:
- A positive Coinbase Premium Index reading would signal renewed US institutional buying and could spark a decisive move above $1,900
- Increased stablecoin inflows to major exchanges would indicate fresh capital entering the market
- Regulatory clarity around the CLARITY Act or other legislation could restore institutional confidence
- Federal Reserve policy shifts toward lower interest rates could improve risk appetite across digital assets
- A break above $2,000 would confirm that the broader recovery structure remains intact and potentially attract momentum traders
Conversely, a sustained break below $1,800 would invalidate the recovery narrative and suggest that weakness could extend toward $1,500 or lower.
Final Thoughts: Patience May Be the Best Strategy 💭
Ethereum's current stagnation below $1,875 reflects genuine uncertainty about near-term direction. Weak US demand, consolidating technical indicators, and macro headwinds create an environment where caution is justified. However, the underlying recovery structure from June lows remains intact, and relative strength against Bitcoin suggests that bulls haven't surrendered conviction entirely.
Traders should wait for clear confirmations before committing significant capital in either direction. A break above $1,907 on strong volume would present a compelling long opportunity, while a failure to hold $1,840 would justify defensive positioning. Until then, Ethereum appears destined for continued consolidation as global and US demand dynamics rebalance.
The next significant move will likely be determined by whether US institutional buyers re-enter the market or whether offshore demand must carry the entire burden of supporting higher prices. Monitoring the Coinbase Premium Index will be as important as watching technical levels in the coming weeks.
You May Also Like

Market Analysis
XRP Price Falls 5% as Leverage Hits Seven-Month High
August 26, 2026

Market Analysis
Crypto Market Hits Extreme Greed: What This Means for Bitcoin
August 26, 2026

Market Analysis
Ethereum Price Rally Overheats Below $2,550 Resistance
August 26, 2026

Market Analysis
Hyperliquid Price Rally: HYPE Targets $97 Amid $80 Support
August 25, 2026