Category:
Market AnalysisEthereum Price Stalls Below $2K: Market Fear Halts Breakout

Ethereum finds itself at a critical juncture as the second-largest cryptocurrency struggles to break through the psychological $2,000 barrier. 📊 Trading near $1,922, ETH has spent the past several trading sessions consolidating just below this key resistance level, despite a modest daily recovery of 0.6%. The inability to sustain a decisive move higher reveals deeper market anxieties that extend far beyond technical price levels.
Market Consolidation: The Technical Picture 📈
The current price action tells a story of indecision and caution. Ethereum briefly touched the $1,970–$1,980 range earlier in the week, only to face repeated selling pressure that prevented a clean break toward $2,000. This pattern suggests that while buyers possess enough strength to defend lower levels, they lack the conviction needed to drive prices decisively higher.
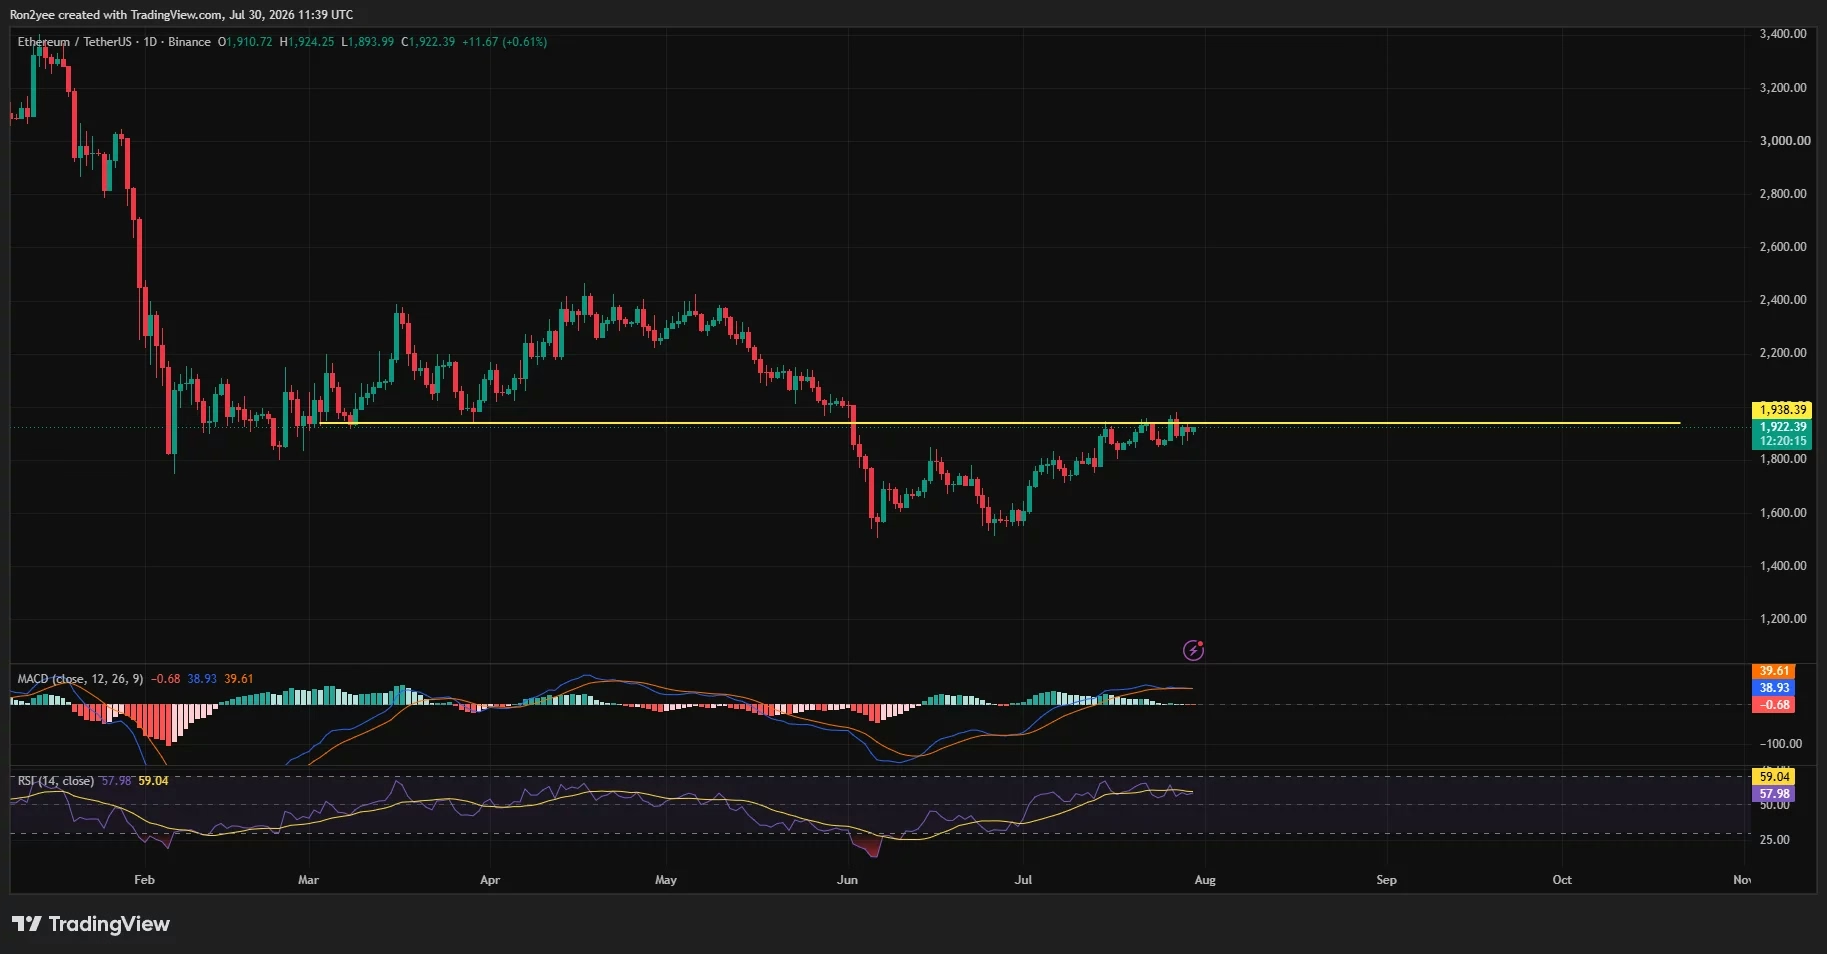
On the daily timeframe, immediate resistance sits near $1,938—a level that previously served as support during February and March. The fact that Ethereum's recent candles have formed directly below this area indicates that both bulls and bears are waiting for a more compelling catalyst before committing significant capital. The daily RSI reading of 58 reflects this equilibrium perfectly, maintaining ETH above neutral territory while falling short of overbought extremes.
Momentum indicators paint a picture of exhaustion. The MACD lines are converging, and the histogram has slipped slightly below zero, signaling that the recovery from June's low near $1,530 has lost its initial thrust. These technical signals point to consolidation rather than outright bearish reversal, but they also suggest that overhead supply remains formidable as Ethereum approaches the $2,000 psychological threshold.
Federal Reserve Policy: The Macro Headwind 💰
Much of Ethereum's struggle stems from macroeconomic forces beyond the crypto market's control. The Federal Reserve's recent decision to maintain its benchmark interest rate at 3.5%–3.75% delivered little encouragement to risk-asset investors. Although the rate hold was widely anticipated, it removed a potential bullish catalyst that might have sparked renewed appetite for high-beta assets like cryptocurrencies.
What proved particularly noteworthy was the dissent within the Federal Open Market Committee. Three members voted for an additional quarter-point rate increase, a reminder that inflation concerns persist within the central bank's leadership. Fed Chair Kevin Warsh reinforced the institution's commitment to returning inflation to its 2% target, leaving the door open for further tightening if price pressures don't moderate.
This policy environment creates a challenging backdrop for cryptocurrencies. Higher interest rates increase the relative appeal of traditional interest-bearing assets—bonds, savings accounts, and money market funds—while simultaneously raising the opportunity cost of holding non-yielding assets like Bitcoin and Ethereum. For Ethereum specifically, the recent recovery has depended partly on investors becoming more willing to rotate back into risk assets. Restrictive monetary policy undermines that willingness.
Geopolitical Tensions Add to Market Anxiety 🌍
Beyond monetary policy, geopolitical uncertainty has injected additional volatility into financial markets. On July 30, renewed tensions between the United States and Iran sent Brent crude oil prices surging more than 7% higher. Simultaneously, major equity indices declined sharply: the Dow fell 2.2%, the S&P 500 lost 1.5%, and the Nasdaq dropped 1.7%.
This combination of rising energy prices coupled with weakening equities creates a concerning scenario for inflation dynamics. Energy represents a significant component of the consumer price index, and elevated oil prices threaten to keep inflation elevated even as the Fed attempts to bring it under control. The prospect of persistent inflation weighs heavily on cryptocurrency valuations, as it justifies continued restrictive monetary policy.
The market's broader sentiment reflects this caution. The Fear and Greed Index remained firmly in "Fear" territory on July 30, indicating that traders have yet to regain confidence despite Ethereum's recovery from its June lows. This psychological barrier often proves as significant as technical resistance levels.
Regulatory Uncertainty Removes a Key Catalyst 📋
Ethereum's struggle also reflects disappointment in the regulatory landscape. The US Senate has postponed work on the Digital Asset Market Clarity Act (CLARITY Act) while lawmakers prioritize a Russia sanctions package and federal nominations. This delay significantly reduces the likelihood of meaningful legislative progress before the Senate's August recess.
The CLARITY Act's importance cannot be overstated. The bill aims to clarify how the Securities and Exchange Commission and Commodity Futures Trading Commission divide oversight of digital assets—a fundamental question that has created uncertainty for institutional participants. While Ethereum already benefits from access to regulated US spot exchange-traded funds, broader market-structure rules could encourage exchanges, brokers, and institutions to substantially expand their cryptocurrency operations.
Without these clarifying rules on the horizon, institutional investors lack a near-term regulatory catalyst to justify aggressive position-building. This regulatory uncertainty, combined with macroeconomic headwinds, creates a risk-off environment precisely when Ethereum needs strong institutional demand to break through $2,000.
Capital Flows: The Missing Ingredient 💸
Data from institutional Ethereum ETF flows tells an important story about the current market dynamic. US spot Ethereum ETFs recorded approximately $18.65 million in net outflows on July 29, reversing the previous session's inflows. While this withdrawal was modest compared to the funds' recent weekly gains, it demonstrated that institutional demand was insufficient to push Ethereum through $2,000 during its latest attempt.
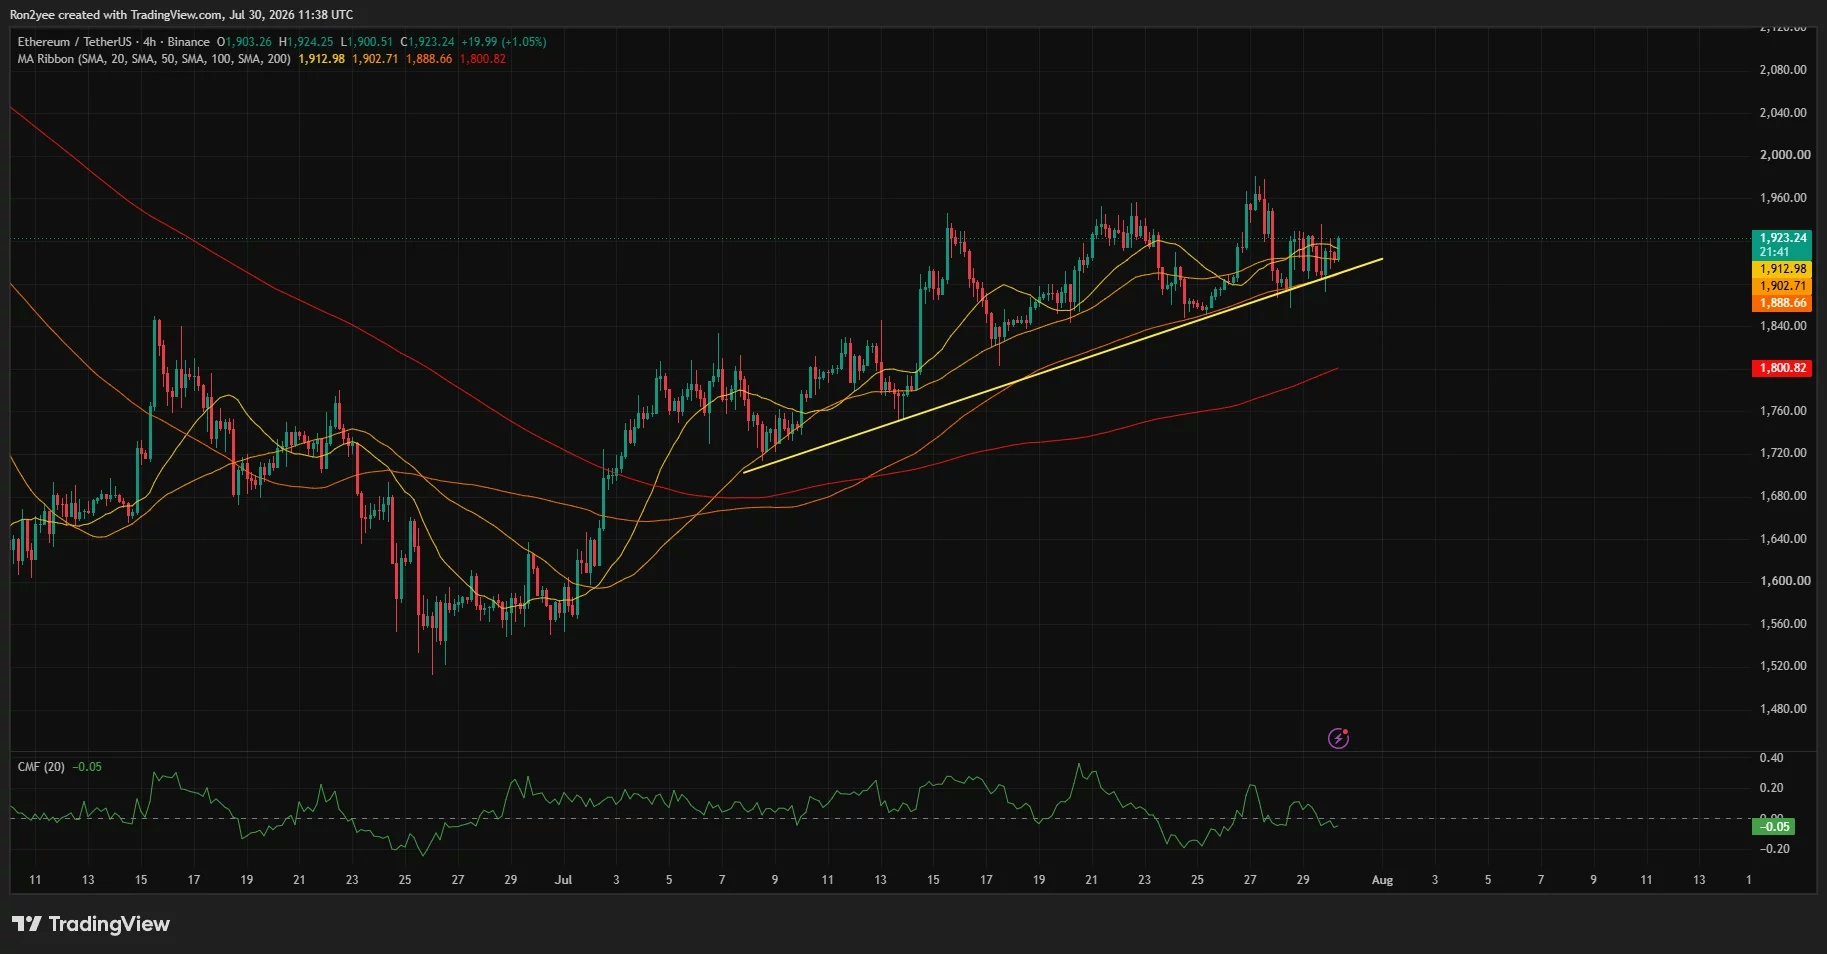
This capital flow weakness shows up clearly in technical indicators. The Chaikin Money Flow indicator stands at minus 0.05—a negative reading that signals capital flow has not confirmed the rising price structure visible on the 4-hour chart. This divergence increases the risk that another push toward resistance will fade without stronger spot demand materializing.
The 4-Hour Timeframe: A More Constructive Picture ⏰
While the daily chart and macro backdrop appear challenged, Ethereum's 4-hour timeframe presents a more optimistic technical setup. ETH trades above its 20-period, 50-period, 100-period, and 200-period simple moving averages, which are positioned near $1,913, $1,903, $1,889, and $1,801 respectively. An ascending trendline continues to support the recovery, providing buyers with a clear path toward $1,960 and ultimately $2,000.
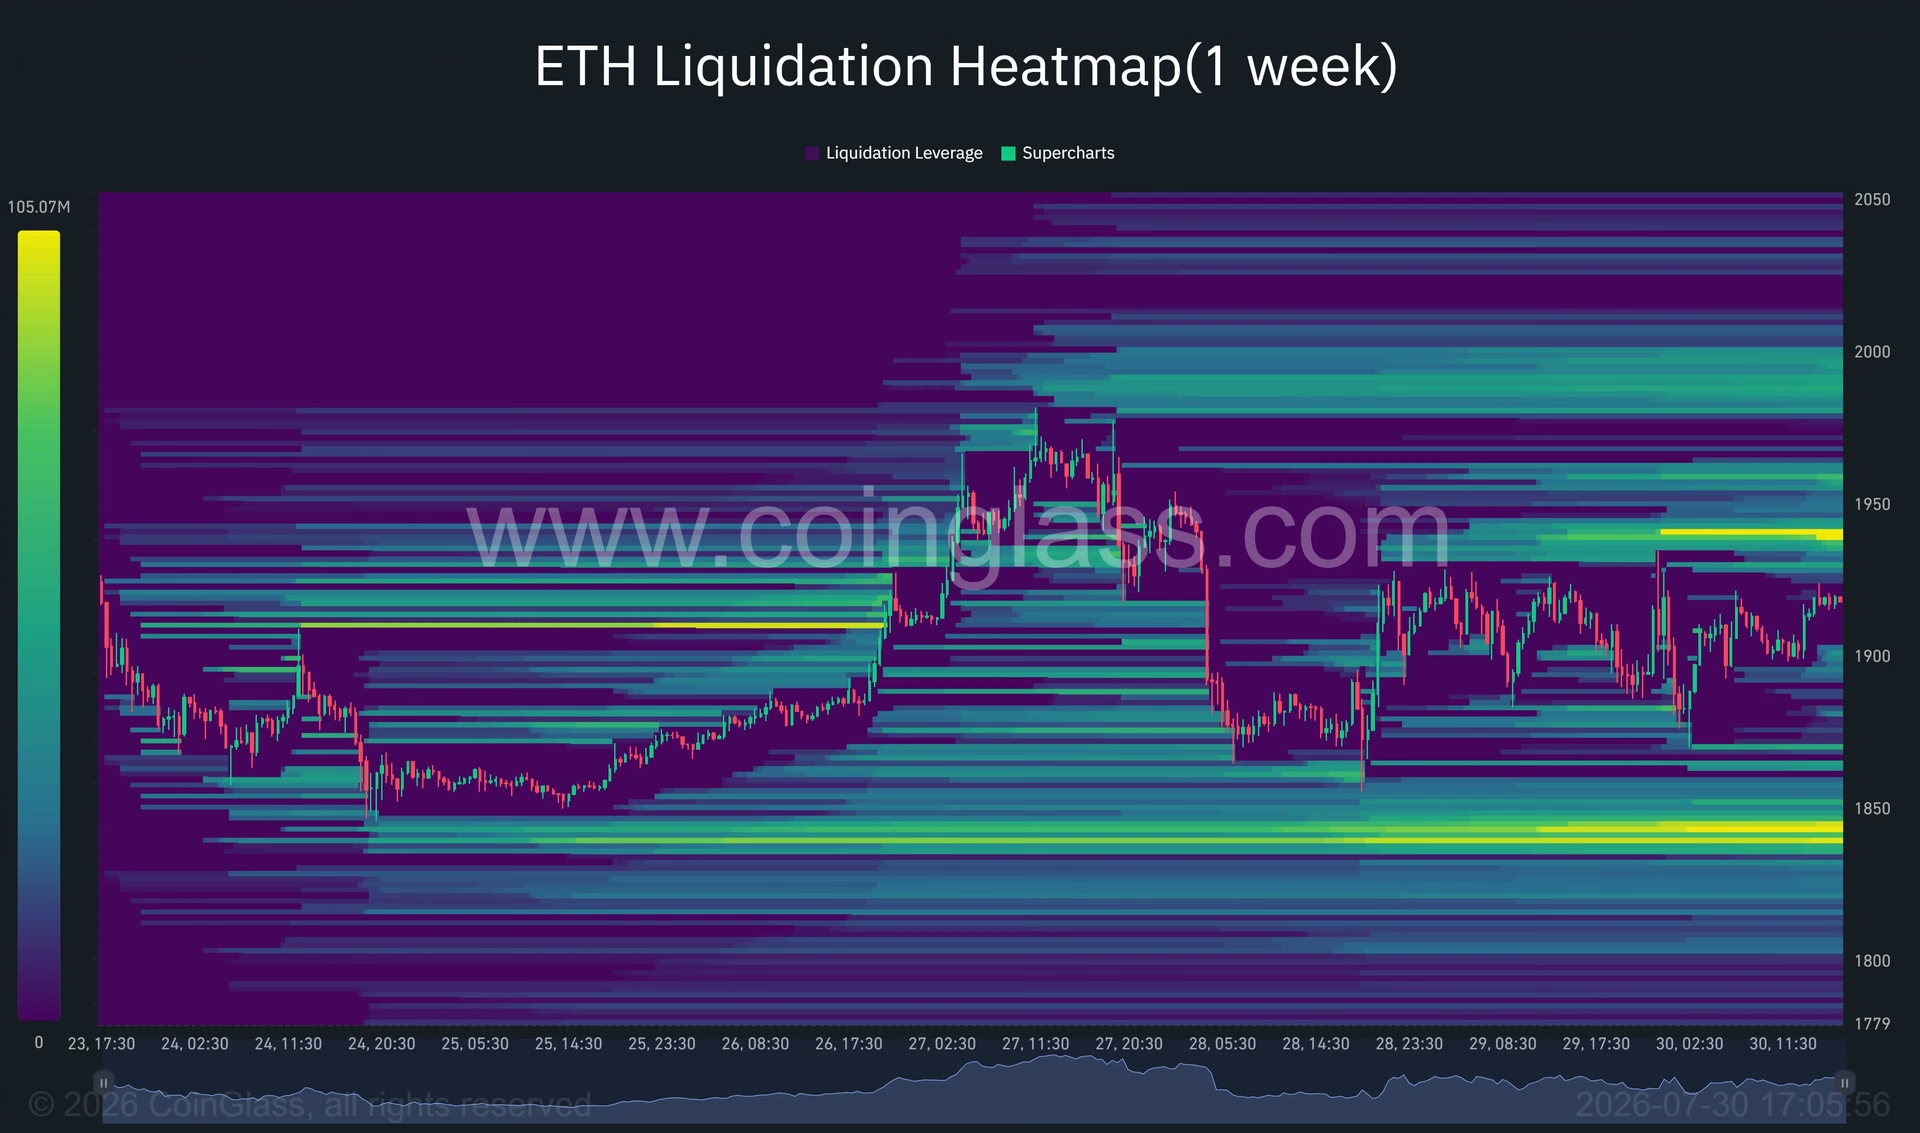
As long as Ethereum maintains support above the $1,888–$1,900 region, this constructive structure remains intact. The liquidation heatmap reveals concentrated liquidity near $1,940, followed by a wider cluster around $1,980–$2,000. A successful break through $1,940 could trigger short liquidations and provide the momentum needed to carry ETH toward the psychological $2,000 barrier.
Conversely, downside liquidity concentrates near $1,840. If Ethereum loses the ascending trendline and breaks below $1,888, this lower cluster could attract selling pressure and expose the 200-period moving average near $1,800.
What Analysts Are Watching 🔍
Crypto market observers remain cautiously optimistic about Ethereum's medium-term prospects. Prominent analysts suggest that as long as ETH maintains support above its 21-day and 50-day moving averages, higher prices remain likely. However, the path forward requires either a shift in macroeconomic sentiment or a catalyst strong enough to overcome current institutional hesitation.
The key question facing the market is whether Ethereum can generate the capital inflows necessary to break through $2,000 before broader market conditions improve. Institutional demand has proven insufficient during recent attempts, suggesting that retail participation or a fundamental catalyst will be needed to spark a decisive breakout.
Looking Ahead: Key Levels and Scenarios 🎯
Ethereum's near-term trajectory hinges on several critical levels:
- Resistance: $1,938 (daily), $1,960, and $2,000 (psychological barrier)
- Support: $1,888–$1,900 (ascending trendline), $1,840 (lower liquidity cluster), $1,800 (200-day MA)
- Macro catalysts to watch: Fed policy signals, inflation data, regulatory developments, and geopolitical tensions
The $2,000 level represents more than just a technical barrier—it symbolizes investor confidence in Ethereum's recovery narrative. Breaking above it decisively would signal that buyers have overcome macro headwinds and institutional hesitation. Conversely, a sustained break below $1,888 would suggest that current market fears have gained the upper hand.
The Bottom Line 💡
Ethereum's consolidation below $2,000 reflects a market caught between competing forces. Technical strength on the 4-hour chart conflicts with weak institutional capital flows, restrictive monetary policy, geopolitical uncertainty, and delayed regulatory clarity. While the ascending trendline provides support for buyers, the lack of decisive capital inflows suggests that Ethereum lacks the conviction needed for a clean breakout.
Investors should monitor the $1,888–$1,900 support zone closely. As long as Ethereum holds this level, the bullish structure remains intact. However, a break below this area could expose lower targets and signal that market fear has temporarily overcome recovery momentum. The coming days will be crucial in determining whether Ethereum can overcome current headwinds or whether consolidation continues.
You May Also Like

Market Analysis
XRP Price Falls 5% as Leverage Hits Seven-Month High
August 26, 2026

Market Analysis
Crypto Market Hits Extreme Greed: What This Means for Bitcoin
August 26, 2026

Market Analysis
Ethereum Price Rally Overheats Below $2,550 Resistance
August 26, 2026

Market Analysis
Hyperliquid Price Rally: HYPE Targets $97 Amid $80 Support
August 25, 2026