Category:
Market AnalysisEthereum Price Surges Toward $2,000 Resistance Breakout

Ethereum has captured renewed market attention as the world's leading smart contract platform edges closer to a pivotal technical milestone. 🚀 The cryptocurrency recently climbed to $1,912, representing a meaningful recovery that has reignited bullish sentiment among traders and analysts alike. This advance marks a significant moment in Ethereum's ongoing price discovery process, with multiple technical indicators suggesting that a breakthrough above $2,000 could unlock substantially higher targets.
Ethereum Price Momentum Builds Strength 📈
The recent Ethereum price movement has demonstrated impressive resilience, with ETH climbing nearly 2% as buyers successfully defended critical support levels. The digital asset traded between an intraday low of $1,872 and a high of $1,915, showcasing the tug-of-war between bulls and bears that has characterized recent trading sessions.
What makes this price action particularly noteworthy is that Ethereum has reclaimed ground above its 20-day, 50-day, and 100-day simple moving averages—a development that technical analysts typically view as a positive signal for near-term momentum. These moving averages, positioned at $1,889, $1,845, and $1,869 respectively, now serve as dynamic support levels that could help sustain any further upside moves.
The daily relative strength index has climbed to 56.5, above its signal average of 53, indicating that buying pressure has intensified without yet reaching overbought conditions. This balanced momentum setup creates an environment where further gains remain possible without requiring an immediate pullback for consolidation.
The $2,000 Resistance Level: Why It Matters 🎯
While Ethereum's recent recovery has been encouraging, the real test lies ahead at the $2,000 psychological barrier. This level represents far more than a round number—it coincides with Ethereum's 200-day moving average, currently positioned near $2,009, creating a convergence of technical resistance that cannot be ignored.
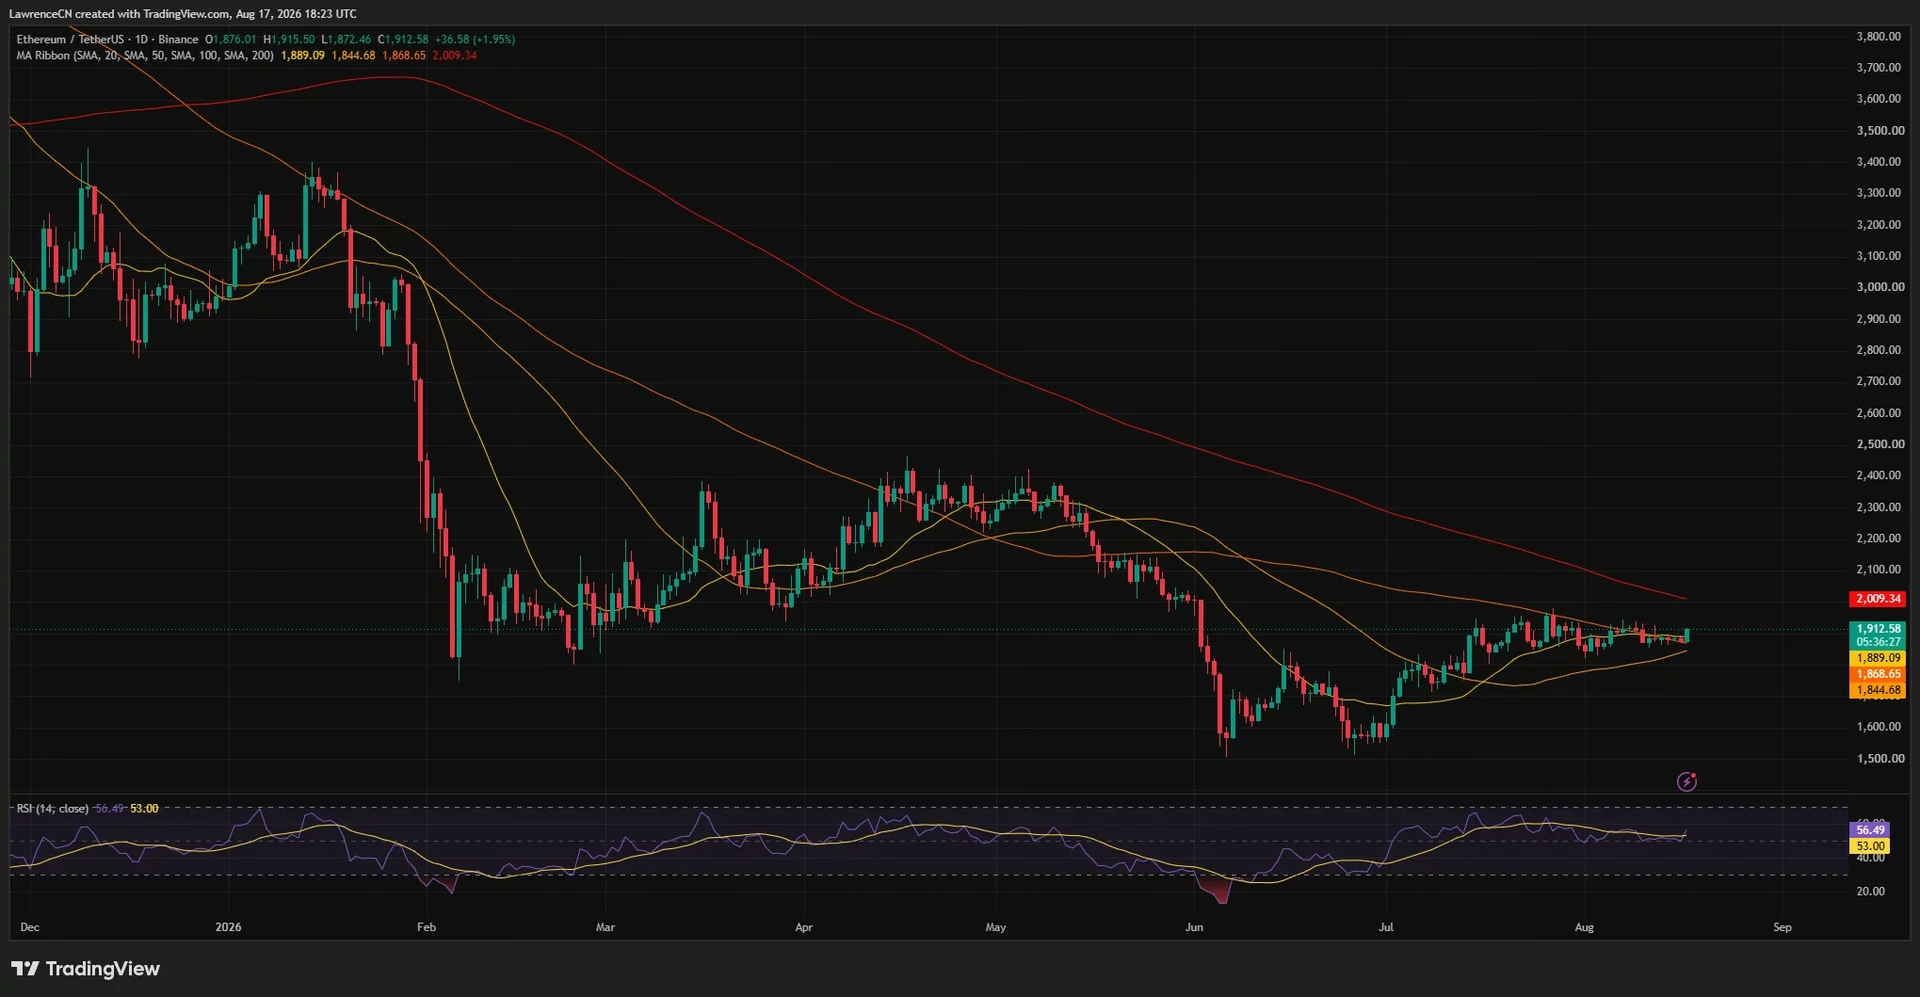
The importance of this zone cannot be overstated. Ethereum has remained trapped below its declining 200-day average since late 2025, and breaking decisively above this level would represent a structural shift in the asset's technical picture. Analysts have noted that ETH has not traded convincingly above its daily Ichimoku Cloud since October 2025, making any breakthrough here a significant event.
Tom Lee, the well-known Fundstrat co-founder, acknowledged the technical significance of this setup, expressing support for the prospect of an Ethereum breakout above its daily cloud. At current prices, clearing this resistance would require approximately a 3.5% advance, which would position ETH near $1,980—tantalizingly close to the $2,000 level.
Liquidation Clusters Signal Volatile Trading Ahead ⚡
The cryptocurrency derivatives market has positioned itself for significant price movement, with liquidation heatmaps revealing important clusters of leveraged positions at multiple price levels. Understanding these liquidation zones provides valuable insight into where sharp price moves might occur.
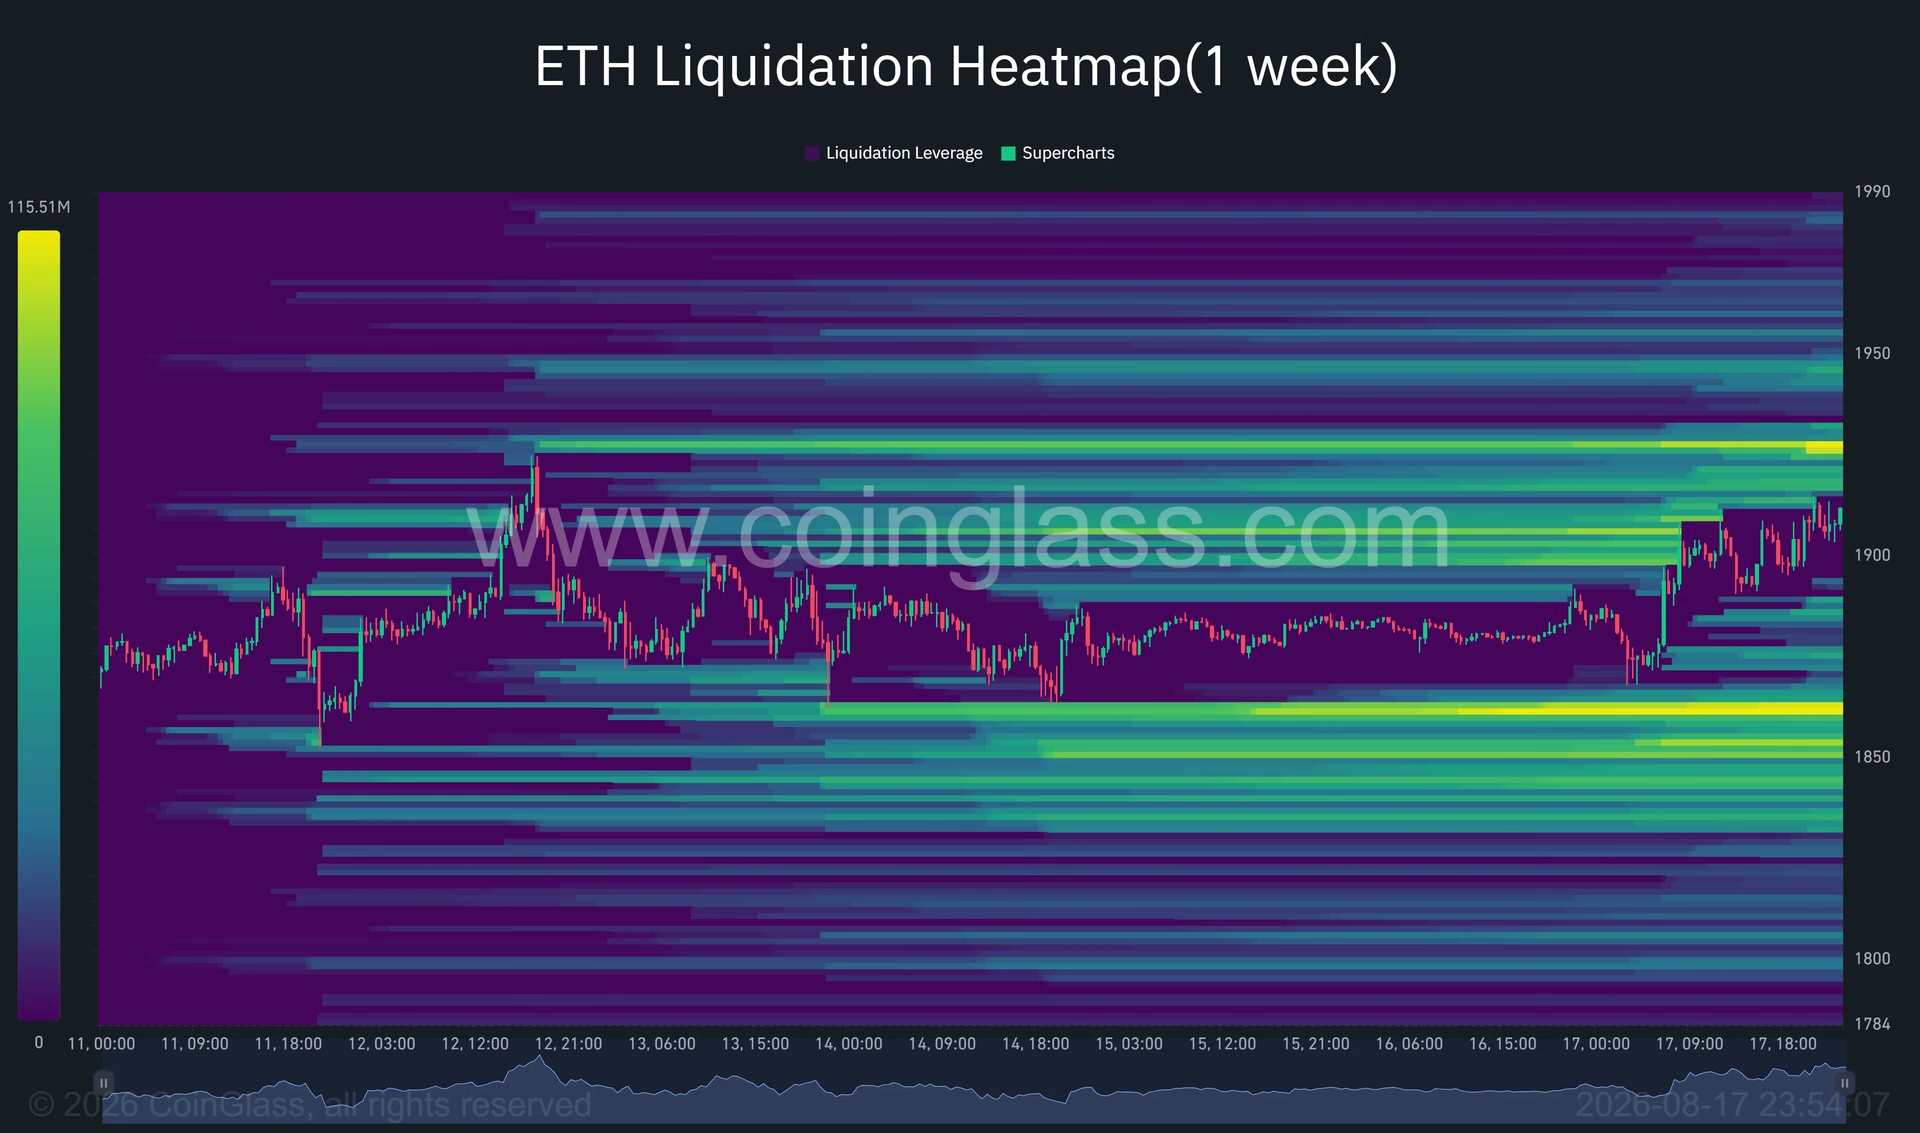
On the upside, the most concentrated resistance appears between $1,945 and $1,950, with additional leverage extending toward $1,960. A move through the $1,925 level could trigger forced closures of bearish positions, potentially creating a cascade of buying that accelerates an Ethereum price test of the upper $1,900 region.
Downside liquidation exposure tells a different story. Substantial long-side liquidity sits below the market, with concentrated clusters near $1,860 and a wider band between approximately $1,835 and $1,855. If Ethereum loses the $1,870 support level, these lower liquidation pools could draw price toward $1,700 before any meaningful rebound opportunity emerges.
Technical Analysis Points to $2,800 as Potential Target 🌟
Michael van de Poppe, a respected cryptocurrency analyst, has outlined a constructive technical setup based on Ethereum's pattern of higher highs and higher lows. His analysis suggests that once ETH breaks decisively through $2,000, the asset may not linger at that level for extended periods.
According to van de Poppe's bullish scenario, Ethereum could experience a sharp advance similar to the powerful moves observed earlier in 2025. The analyst has identified $2,200 as a potential temporary stopping point before a broader advance toward $2,800. These ambitious targets remain conditional on Ethereum first establishing itself above $2,000 and holding that level through the end of a trading day.
This analysis reflects the broader sentiment among technical traders that once Ethereum breaks above its key resistance zone, momentum could accelerate rapidly. The combination of technical breakout and liquidation cascade effects could create the type of sharp move that van de Poppe envisions.
Market Structure Favors Bulls—For Now 💪
The current technical setup presents a scenario where buyers hold the advantage, provided Ethereum maintains its position above the cluster of daily moving averages. The primary support levels are clearly defined: the 20-day average at $1,889, followed by $1,870 and the $1,845–$1,860 region.
On the upside, bulls must first navigate through leveraged resistance near $1,925 and $1,950 before confronting the critical $1,980–$2,010 zone where multiple forms of resistance converge. A daily close above $2,010 would significantly improve Ethereum's longer-term technical structure and validate the path toward the higher targets identified by analysts.
Conversely, failure to hold $1,870 would weaken the technical setup considerably and expose the liquidation-heavy zone below $1,860, potentially triggering a cascade of long liquidations that could push Ethereum toward $1,700.
ETF Flows Remain Lukewarm Despite Price Recovery 📊
Interestingly, the recent Ethereum price recovery has not yet translated into strong demand from US-listed spot Ethereum exchange-traded funds. During the August 10–14 trading week, these products recorded a modest net outflow of $2.26 million, suggesting that institutional investors have remained cautious despite the improving technical picture.
BlackRock's ETHA fund experienced $16.39 million in weekly withdrawals during this period, indicating that the latest price advance has not yet convinced large institutional players to increase their Ethereum exposure. This disconnect between technical improvement and ETF demand could represent either a lagging indicator or a warning sign that the current rally lacks sufficient conviction.
What's Next for Ethereum Price Action? 🔮
The coming trading sessions will prove critical for determining whether Ethereum can establish itself as a genuine breakout candidate. The technical setup remains constructive, with improving momentum indicators and a clear path to higher levels if resistance can be overcome.
However, traders and investors should remain aware that multiple forms of resistance converge in a relatively narrow price band between $1,980 and $2,010. A brief spike through this zone would not necessarily confirm a sustainable breakout—Ethereum must hold above these levels through the close of a trading day to establish genuine technical strength.
The liquidation heatmap suggests that clearing the $1,925 level could trigger a self-reinforcing rally, while failure to hold $1,870 could produce equally sharp downside moves. This binary setup makes risk management essential for any traders positioning for the move.
Key Takeaways for Ethereum Watchers 🎬
Ethereum's current price action represents a pivotal moment in the asset's technical development. The convergence of multiple resistance factors at the $2,000 level creates a natural decision point that will likely determine the direction of the next significant move.
Bullish investors point to improving technical structure, positive momentum indicators, and analyst targets extending toward $2,800 as reasons to expect further upside. Conversely, cautious traders note the lack of strong ETF demand and the substantial downside liquidity that could be accessed if support levels fail.
The next few trading sessions will provide clarity on whether Ethereum can establish itself above $2,000 or whether sellers will defend this critical resistance zone. Until that question is answered, the cryptocurrency remains in a state of technical flux—poised for a significant move in either direction.
You May Also Like

Market Analysis
XRP Price Falls 5% as Leverage Hits Seven-Month High
August 26, 2026

Market Analysis
Crypto Market Hits Extreme Greed: What This Means for Bitcoin
August 26, 2026

Market Analysis
Ethereum Price Rally Overheats Below $2,550 Resistance
August 26, 2026

Market Analysis
Hyperliquid Price Rally: HYPE Targets $97 Amid $80 Support
August 25, 2026