Category:
Market AnalysisEthereum Price Trapped Below $1,920: Is $2,000 Next?

Ethereum finds itself at a critical juncture 🔄, with ETH trading near the $1,905 mark and facing intense pressure from a tightening technical formation that could determine its next significant move. The second-largest cryptocurrency has been consolidating within a narrow range for weeks, creating what technical analysts call a symmetrical triangle—a pattern that typically precedes substantial price movement in either direction.
Understanding Ethereum's Current Technical Setup 📊
The Ethereum price action has developed a distinctive symmetrical triangle pattern on the daily chart, with the upper trendline descending from approximately $1,980 toward the $1,920 resistance level, while the lower boundary has climbed from around $1,800 toward $1,880. This compression of price movement creates what traders call the "apex" of the triangle, where historically, markets tend to break decisively in one direction.
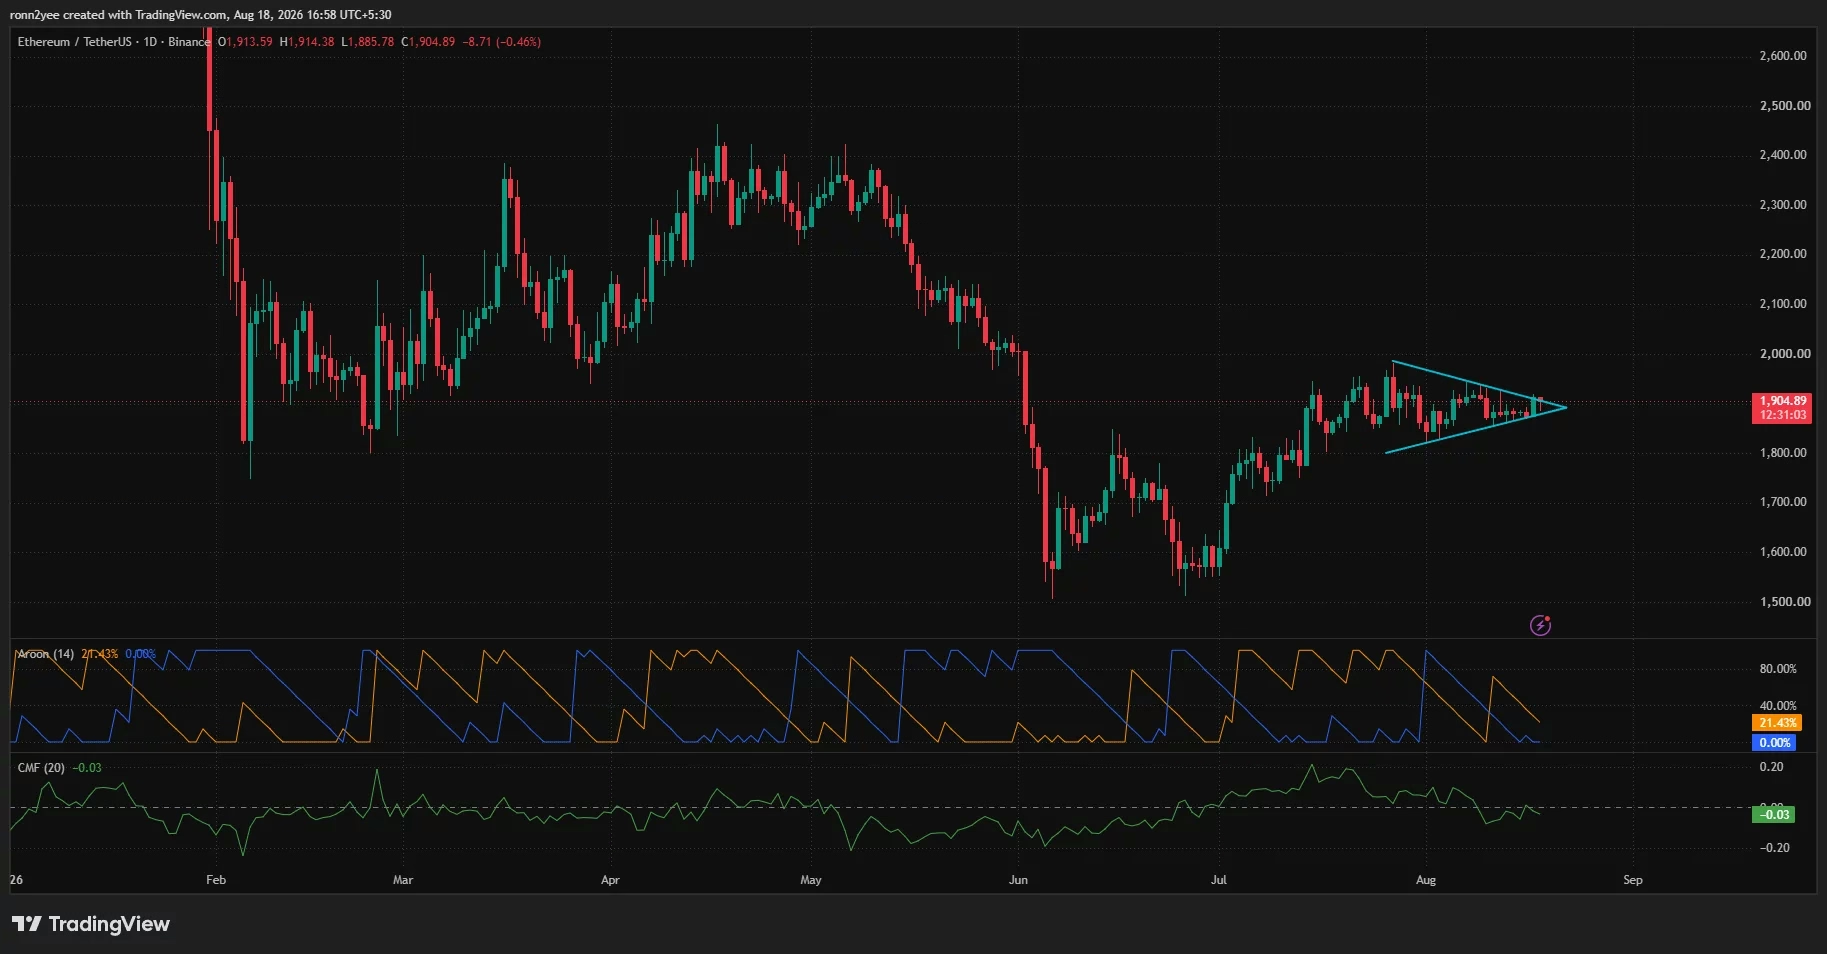
What makes this setup particularly intriguing is that Ethereum's resistance at $1,920 has become the focal point for the entire market narrative. Recent intraday trading has seen ETH oscillate between a low of $1,885.78 and a high of $1,914.38, demonstrating the intense battle between buyers and sellers at these levels. The price remains down approximately 0.5% on the day, but this minor decline masks the larger consolidation story unfolding across multiple timeframes.
The 4-Hour Chart Battle: $1,909 vs. $1,870 🎯
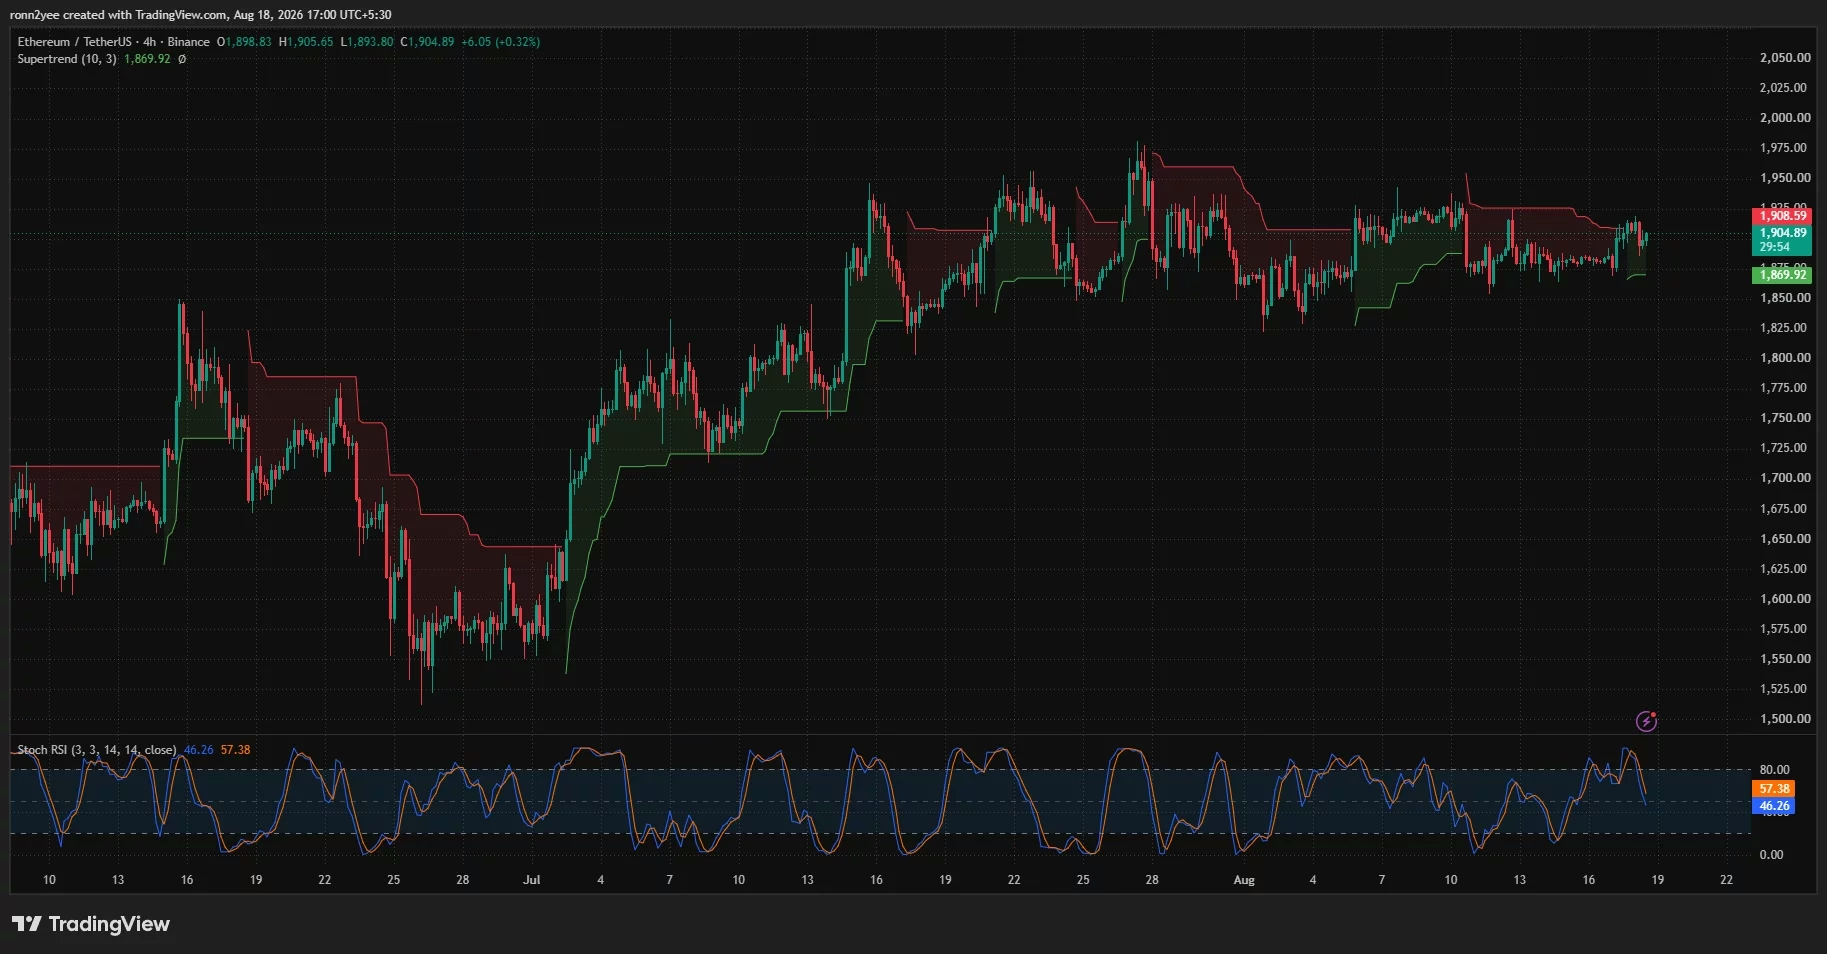
Zooming into the 4-hour timeframe reveals an even more immediate struggle. The Supertrend indicator has placed critical resistance at $1,908.59, with support sitting at $1,869.92. This shorter-term technical setup will likely determine whether Ethereum can muster the momentum needed to challenge the $1,920 resistance.
A confirmed 4-hour candle close above $1,909 would represent a crucial breakthrough, weakening the short-term bearish signal and bringing the $1,920 level into direct focus. Historically, Ethereum has repeatedly struggled in the $1,915 to $1,930 band, making this area the first meaningful test for bullish momentum. The Stochastic RSI indicator has turned lower after approaching overbought territory, with readings at 46.26 and 57.38, suggesting that short-term momentum cooled during the latest push toward resistance.
However, the oscillator remains positioned near the center of its range rather than in oversold territory, indicating that bulls could regain momentum without requiring a deeper reset if ETH holds above $1,890. Failure to clear the Supertrend barrier would expose Ethereum to $1,890, followed by the $1,870 support line. A close below $1,870 would weaken the sequence of higher lows and shift attention toward $1,850.
Liquidation Clusters Reveal Market Sentiment 💧
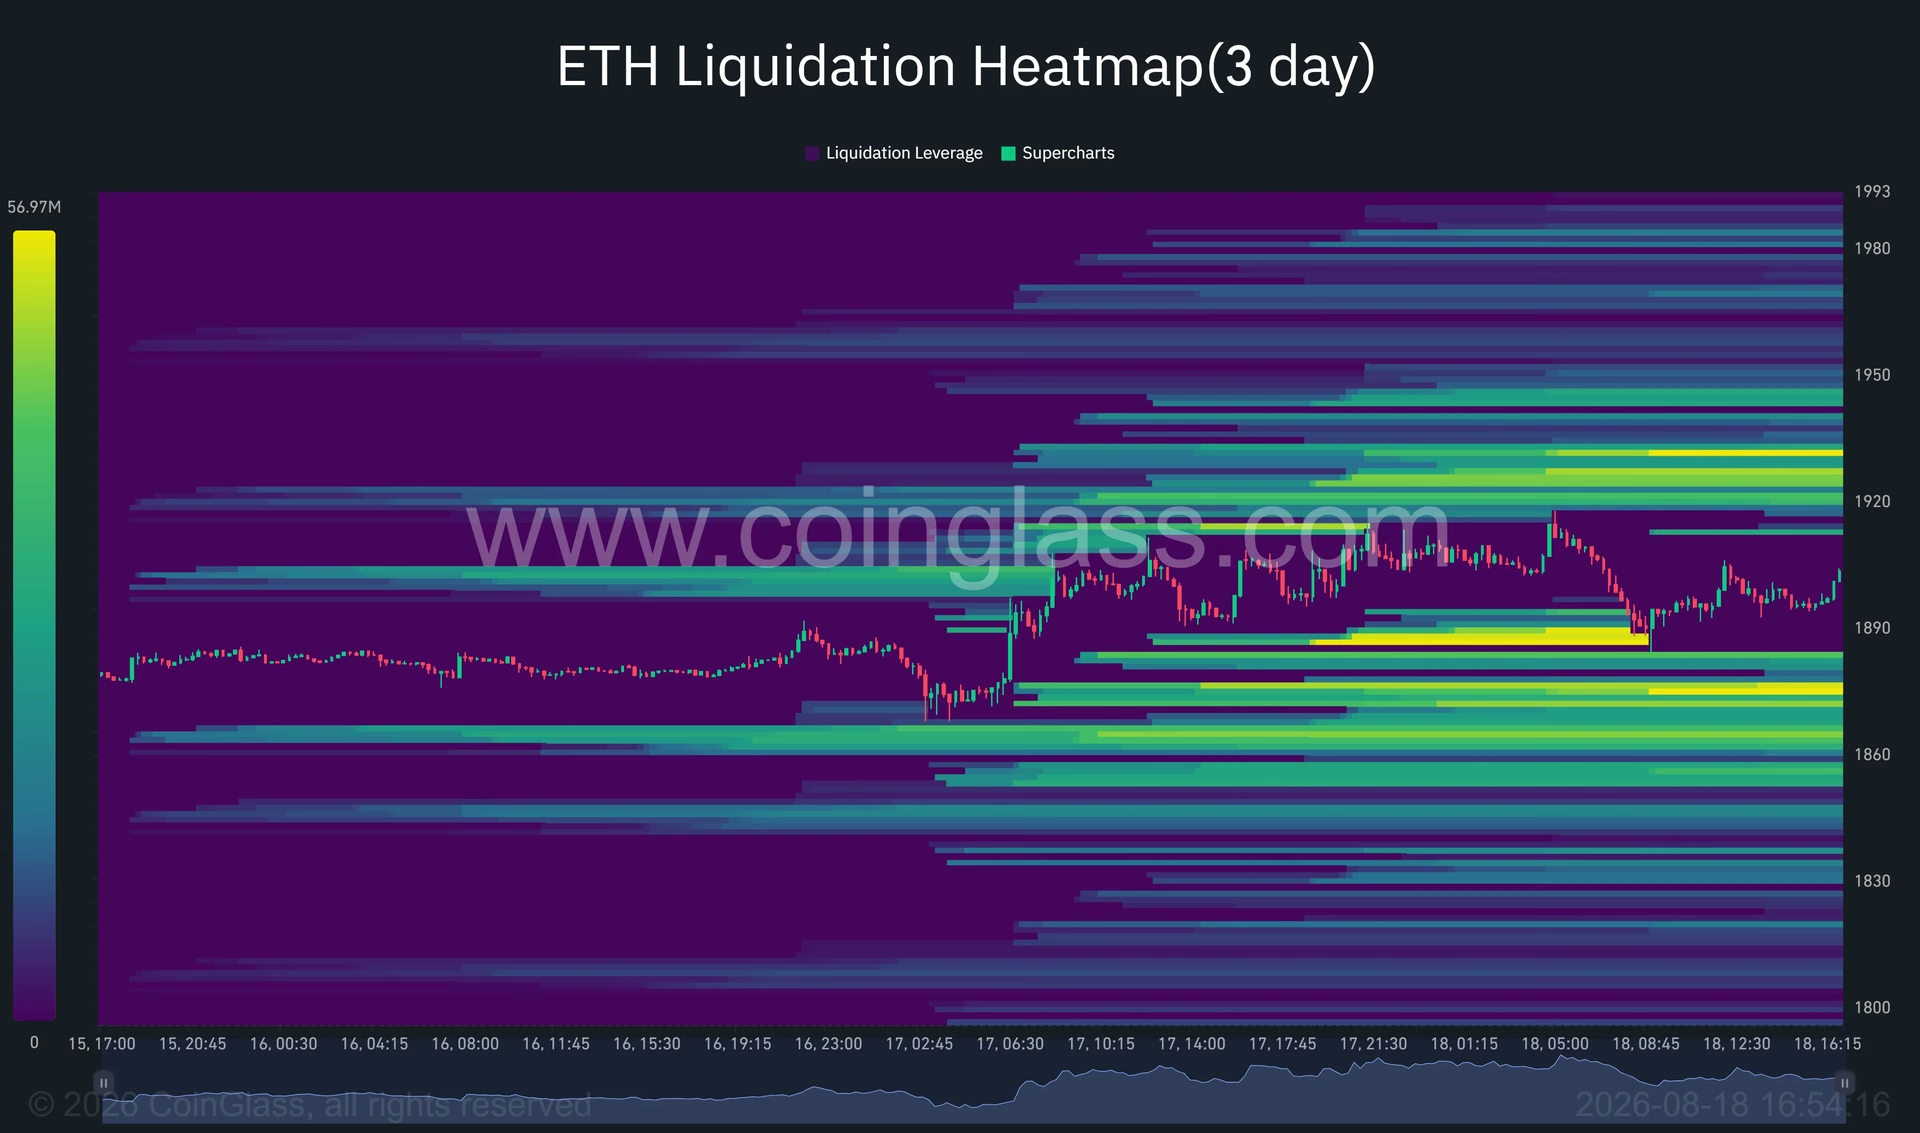
The liquidation landscape provides crucial insight into where leveraged traders have positioned themselves. According to CoinGlass data, the largest concentration of liquidations sits between $1,925 and $1,930, with additional clusters around $1,940–$1,950 and near $1,980. This clustering suggests that if Ethereum price manages to push through $1,920, it could trigger a cascade of short liquidations that would add buying pressure and potentially accelerate the move toward $1,940–$1,950.
On the downside, liquidation zones are equally important. The closest cluster of sell-side liquidity sits around $1,885–$1,890, followed by stronger concentrations near $1,870 and $1,860. Earlier on August 18, price briefly dipped into the $1,885 region before recovering above $1,900, suggesting that buyers remain active near this lower liquidation band. However, repeated tests of this level could weaken its defensive qualities.
The overlap between technical support at $1,870 and the liquidation heatmap makes this level the main short-term invalidation point for the bullish setup. A sweep below $1,885 could pull Ethereum toward $1,870, creating a double-confluence zone that would test buyer conviction.
Why $2,000 Remains the Next Target 🚀
Multiple analysts have identified $2,000 as the psychological and technical target if Ethereum breaks through its current resistance structure. This level sits above the symmetrical triangle and represents recent swing highs that have proven difficult for bulls to overcome. Notably, analyst Michaël van de Poppe stated that once Ethereum price cracks through the $1,920 resistance, "we're going to see a big move happening towards $2,000 here."
However, reaching $2,000 is not a direct path. ETH would first need to clear the supply zone between $1,920 and $1,950, which contains multiple layers of overhead resistance. The psychological significance of the $2,000 level cannot be understated—it represents a key round number that often attracts both technical traders and institutional interest.
Longer-term perspectives suggest that even a break above $2,000 would represent an early recovery step rather than confirmation of a full trend reversal. Analyst Ted Pillows has identified $2,500 as a weekly close target that would confirm Ethereum's bear market had truly ended. At such levels, ETH would reclaim its 200-week simple and exponential moving averages, providing technical confirmation of a sustained recovery.
The Headwinds Holding Ethereum Back 📉
Several macroeconomic and on-chain factors have been weighing on Ethereum's ability to break higher. Large holders, often called "whales," have reportedly sold approximately $3 billion in ETH since August 10, creating selling pressure that has offset bullish momentum. Additionally, decentralized exchange trading volume has contracted by roughly 42% over recent months, indicating reduced participation in Ethereum trading.
The negative Coinbase Premium Index presents another concerning signal. This metric measures the price premium of Ethereum on Coinbase relative to other major exchanges. When negative, it suggests weak demand from US-based buyers—a crucial demographic for driving sustained rallies. US-listed spot Ethereum exchange-traded funds recently recorded $2.26 million in net outflows, interrupting a multi-week inflow streak that had previously supported prices.
Momentum indicators have not yet provided a clear directional signal. Daily Aroon readings showed weakness, with one line at 21.43% and the other at 0%, reflecting a lack of strong recent highs or lows. The Chaikin Money Flow stood at -0.03, slightly below the neutral line, indicating that selling pressure holds a small advantage without confirming strong capital flight.
What's Next for Ethereum? 🔮
The immediate path forward depends on whether Ethereum can consolidate above $1,909 on the 4-hour chart. A confirmed break above this level would validate the bullish triangle pattern and bring $1,920 into play. Success at $1,920 would likely trigger the liquidation cascade discussed earlier, potentially accelerating movement toward $1,940–$1,950.
Investors should monitor several key levels:
- $1,909: 4-hour Supertrend resistance (immediate barrier)
- $1,920: Daily resistance and psychological level
- $1,925–$1,930: Liquidation cluster zone
- $1,870: 4-hour Supertrend support (invalidation level)
- $1,885–$1,890: Lower liquidation band
The broader macro environment also matters significantly. With US inflation slowing to 3.4%, upcoming Federal Reserve minutes could influence risk sentiment and capital flows into cryptocurrencies. If the Fed signals patience with rate hikes, it could provide the catalyst needed for Ethereum price to break through its current consolidation.
Key Takeaways 💡
Ethereum remains trapped in a technically significant symmetrical triangle that could resolve in either direction. The $1,920 resistance level represents the critical battleground, with a break above potentially opening the door to $2,000 and beyond. However, headwinds from whale selling, weak US demand, and reduced trading volume suggest that bulls must prove their conviction before claiming victory.
The next few trading sessions will be crucial in determining whether Ethereum can escape its consolidation phase or faces rejection at resistance. Traders should watch for a confirmed 4-hour close above $1,909 as the green light for bullish momentum, while a breakdown below $1,870 would signal weakness and shift focus toward lower support levels. The path to $2,000 exists, but it requires both technical confirmation and renewed buying pressure from market participants.
For now, patience and discipline remain the trader's best allies in navigating Ethereum's consolidation zone. 🎯
You May Also Like

Market Analysis
XRP Price Falls 5% as Leverage Hits Seven-Month High
August 26, 2026

Market Analysis
Crypto Market Hits Extreme Greed: What This Means for Bitcoin
August 26, 2026

Market Analysis
Ethereum Price Rally Overheats Below $2,550 Resistance
August 26, 2026

Market Analysis
Hyperliquid Price Rally: HYPE Targets $97 Amid $80 Support
August 25, 2026