Category:
Market AnalysisEthereum Stalls Below $2,000: Breakout or Bull Trap?

The Current State of Ethereum's Price Action 📊
Ethereum has captured the attention of traders and investors once again, demonstrating a compelling recovery that pushed the second-largest cryptocurrency to approximately $1,920 during mid-August trading sessions. While this represents a solid 3% gain from recent lows, the persistent resistance near the psychological $2,000 barrier has left market participants questioning whether this rally represents genuine momentum or merely another false breakout attempt.
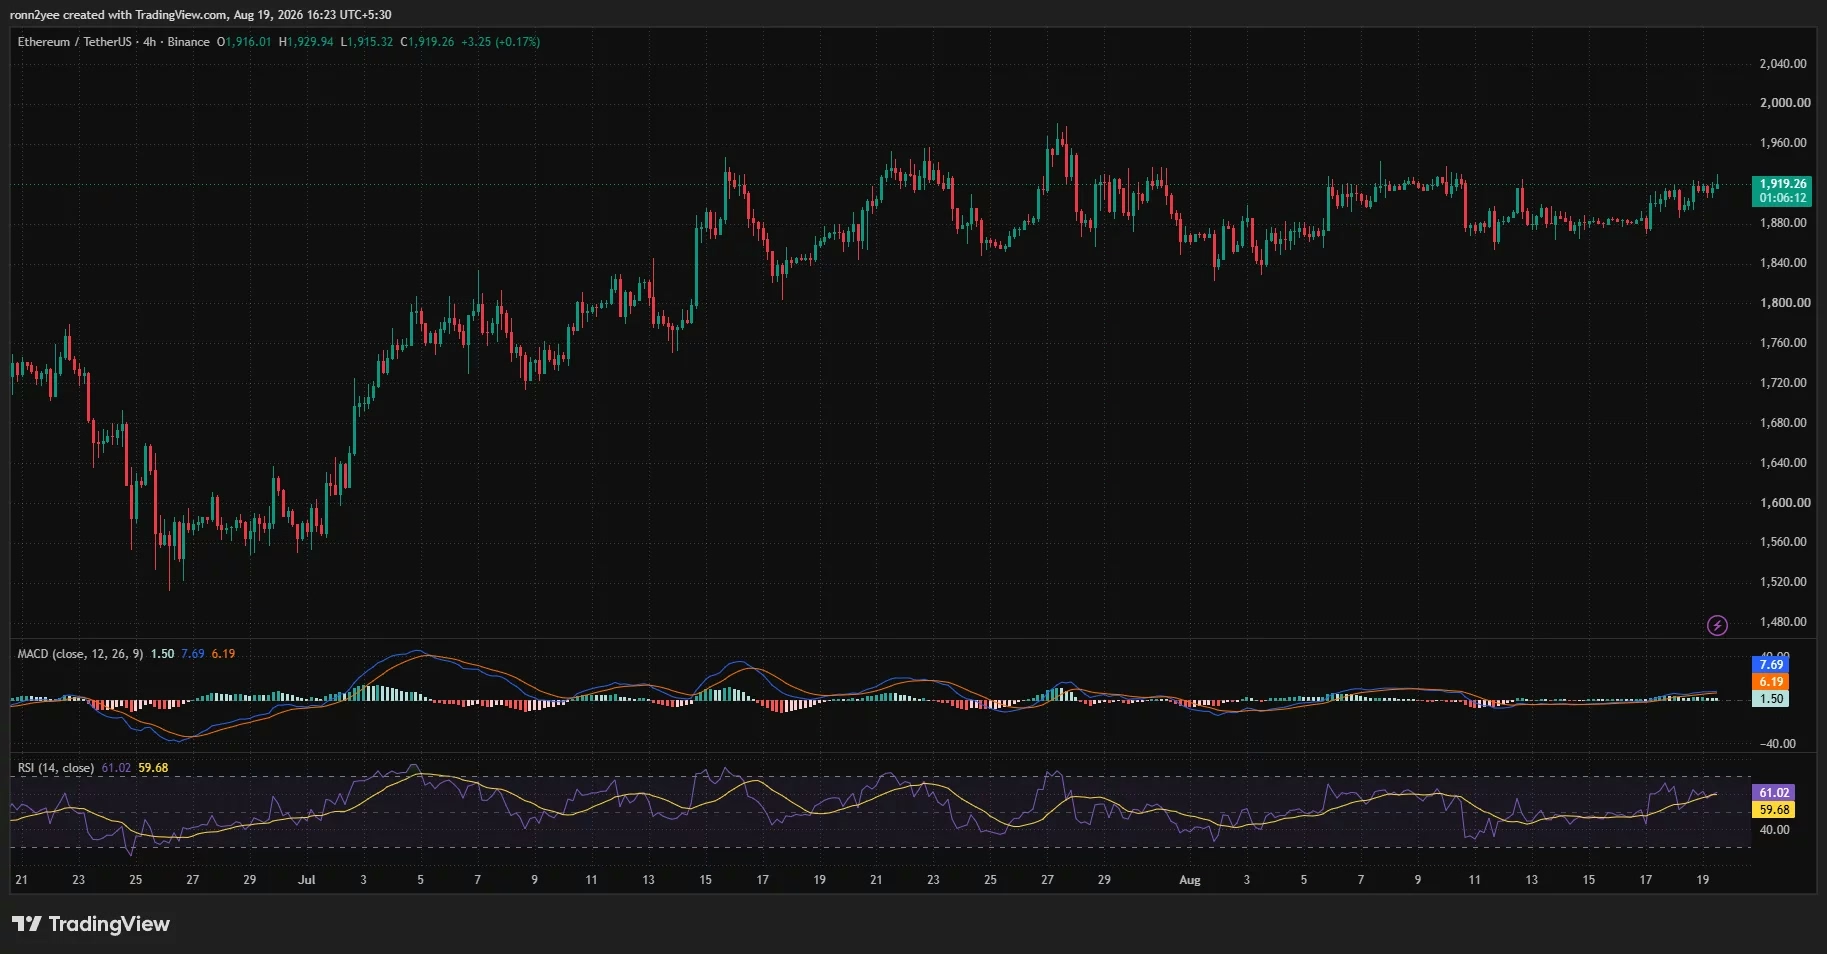
The recovery that began near $1,870 has shown encouraging signs, with Ethereum establishing a series of higher short-term lows—a textbook bullish pattern. However, the inability to decisively break through the $1,986 resistance level has introduced considerable uncertainty into the narrative. This critical juncture has forced analysts and traders to carefully examine the technical setup and underlying market conditions.
Understanding the Technical Momentum 🔧
The 4-hour timeframe presents a particularly intriguing picture for ETH price analysis. The relative strength index has climbed to 61.02, sitting comfortably above its 50 neutral level and moving average of 59.68. This reading indicates genuine buying pressure without yet entering overbought territory—a sweet spot that typically allows for additional upside potential.
The moving average convergence divergence indicator reinforces this constructive setup. The MACD line has crossed above the signal line, with the histogram showing a positive reading of 1.50. While this narrow histogram suggests that bullish momentum exists but hasn't accelerated dramatically, it still represents a meaningful shift in the technical landscape.
Fibonacci Retracements and Key Price Levels 📈
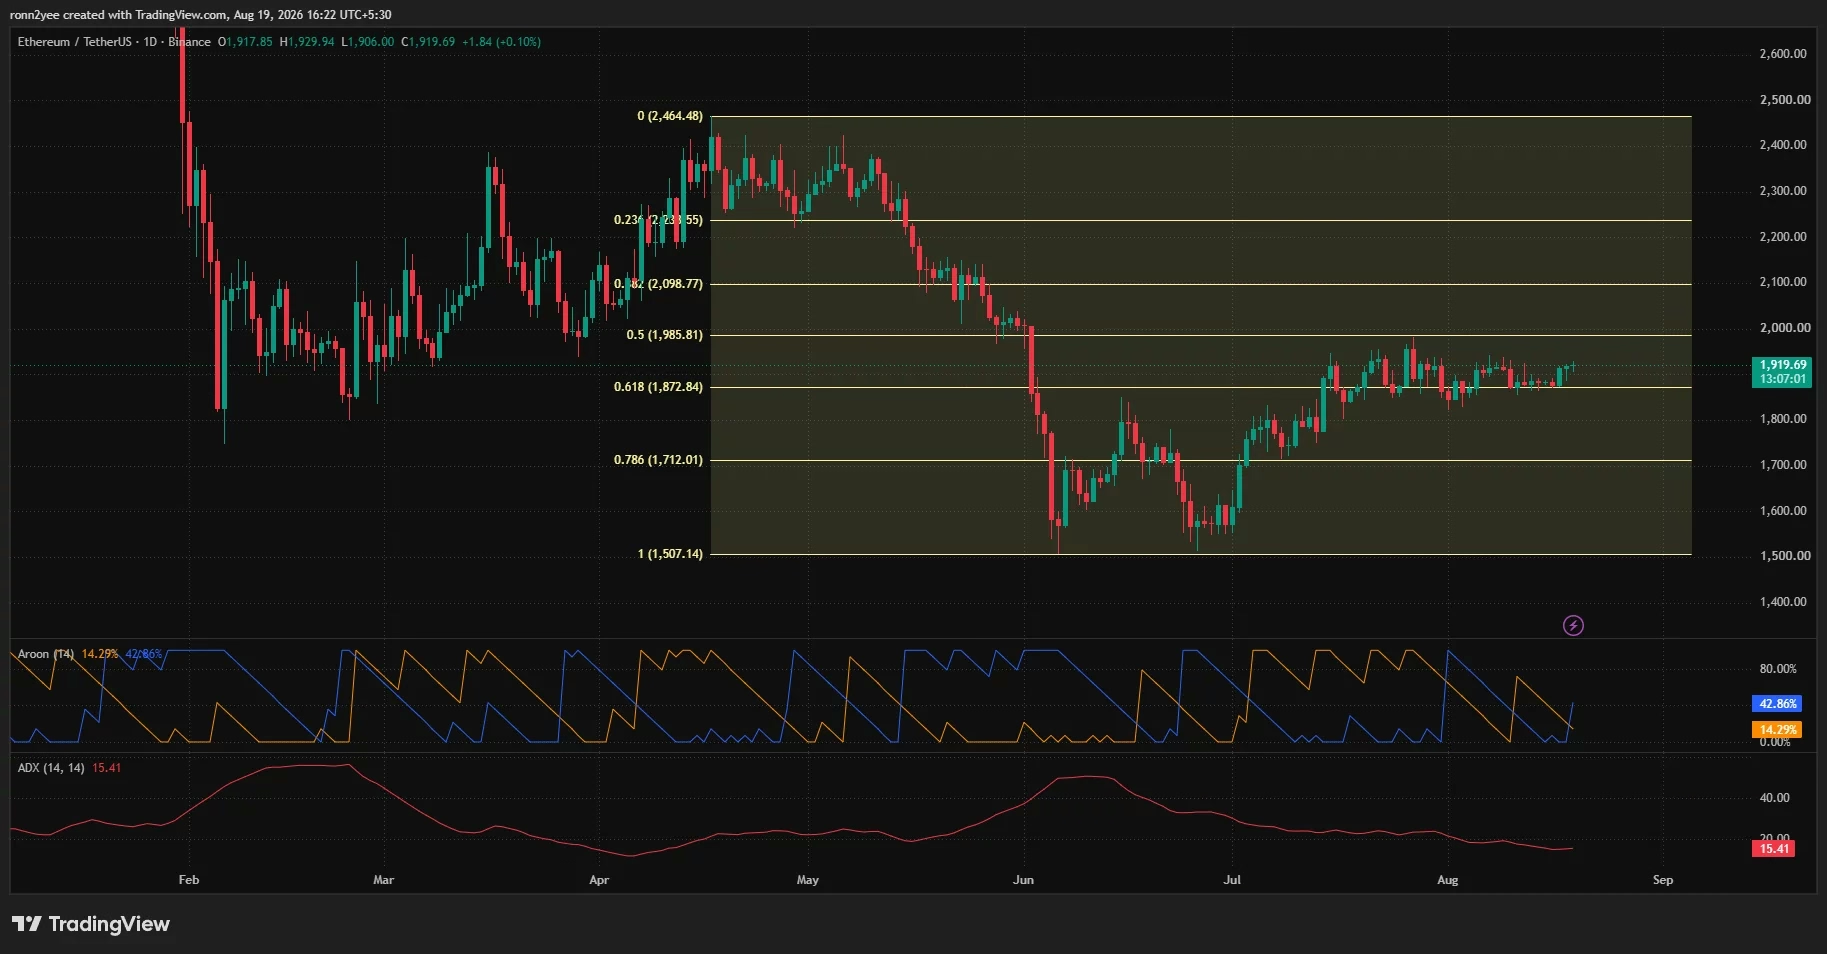
The daily chart reveals a sophisticated technical structure that traders should understand. Ethereum currently trades just above the 0.618 Fibonacci retracement level positioned at $1,872.84—a level derived from the April peak of $2,464.48 and the June low of $1,507.14.
The psychological significance of the $2,000 level cannot be overstated, but the actual technical resistance sits slightly lower at $1,986, which corresponds to the 0.5 Fibonacci retracement. This creates a wider resistance zone that bulls must overcome to establish genuine upward momentum. Breaking above $1,986 would theoretically open the path toward the 0.382 retracement at $2,098.77.
On the downside, support clusters emerge at several critical levels:
- $1,873: The 0.618 Fibonacci retracement and primary support
- $1,850: A psychological level showing strong technical importance
- $1,800: The July consolidation area
- $1,712.01: The next major Fibonacci support level
The Trend Strength Conundrum ⚠️
While momentum indicators flash green, one critical weakness persists: trend strength. The average directional index currently stands at 15.41, well below the 20-25 range typically associated with established trends. This reading suggests that Ethereum remains in a consolidation phase rather than a confirmed directional move.
The Aroon indicator offers a slightly more bullish perspective, with Aroon Up at 42.86% and Aroon Down at 14.29%, indicating that recent highs are exerting more influence than recent lows. However, this early bullish signal requires confirmation through stronger momentum and decisive price action.
This disconnect between positive momentum indicators and weak trend strength creates the central dilemma facing Ethereum traders: the setup looks technically sound on paper, but the underlying conviction remains questionable.
Liquidation Heatmaps Reveal Market Structure 🔥
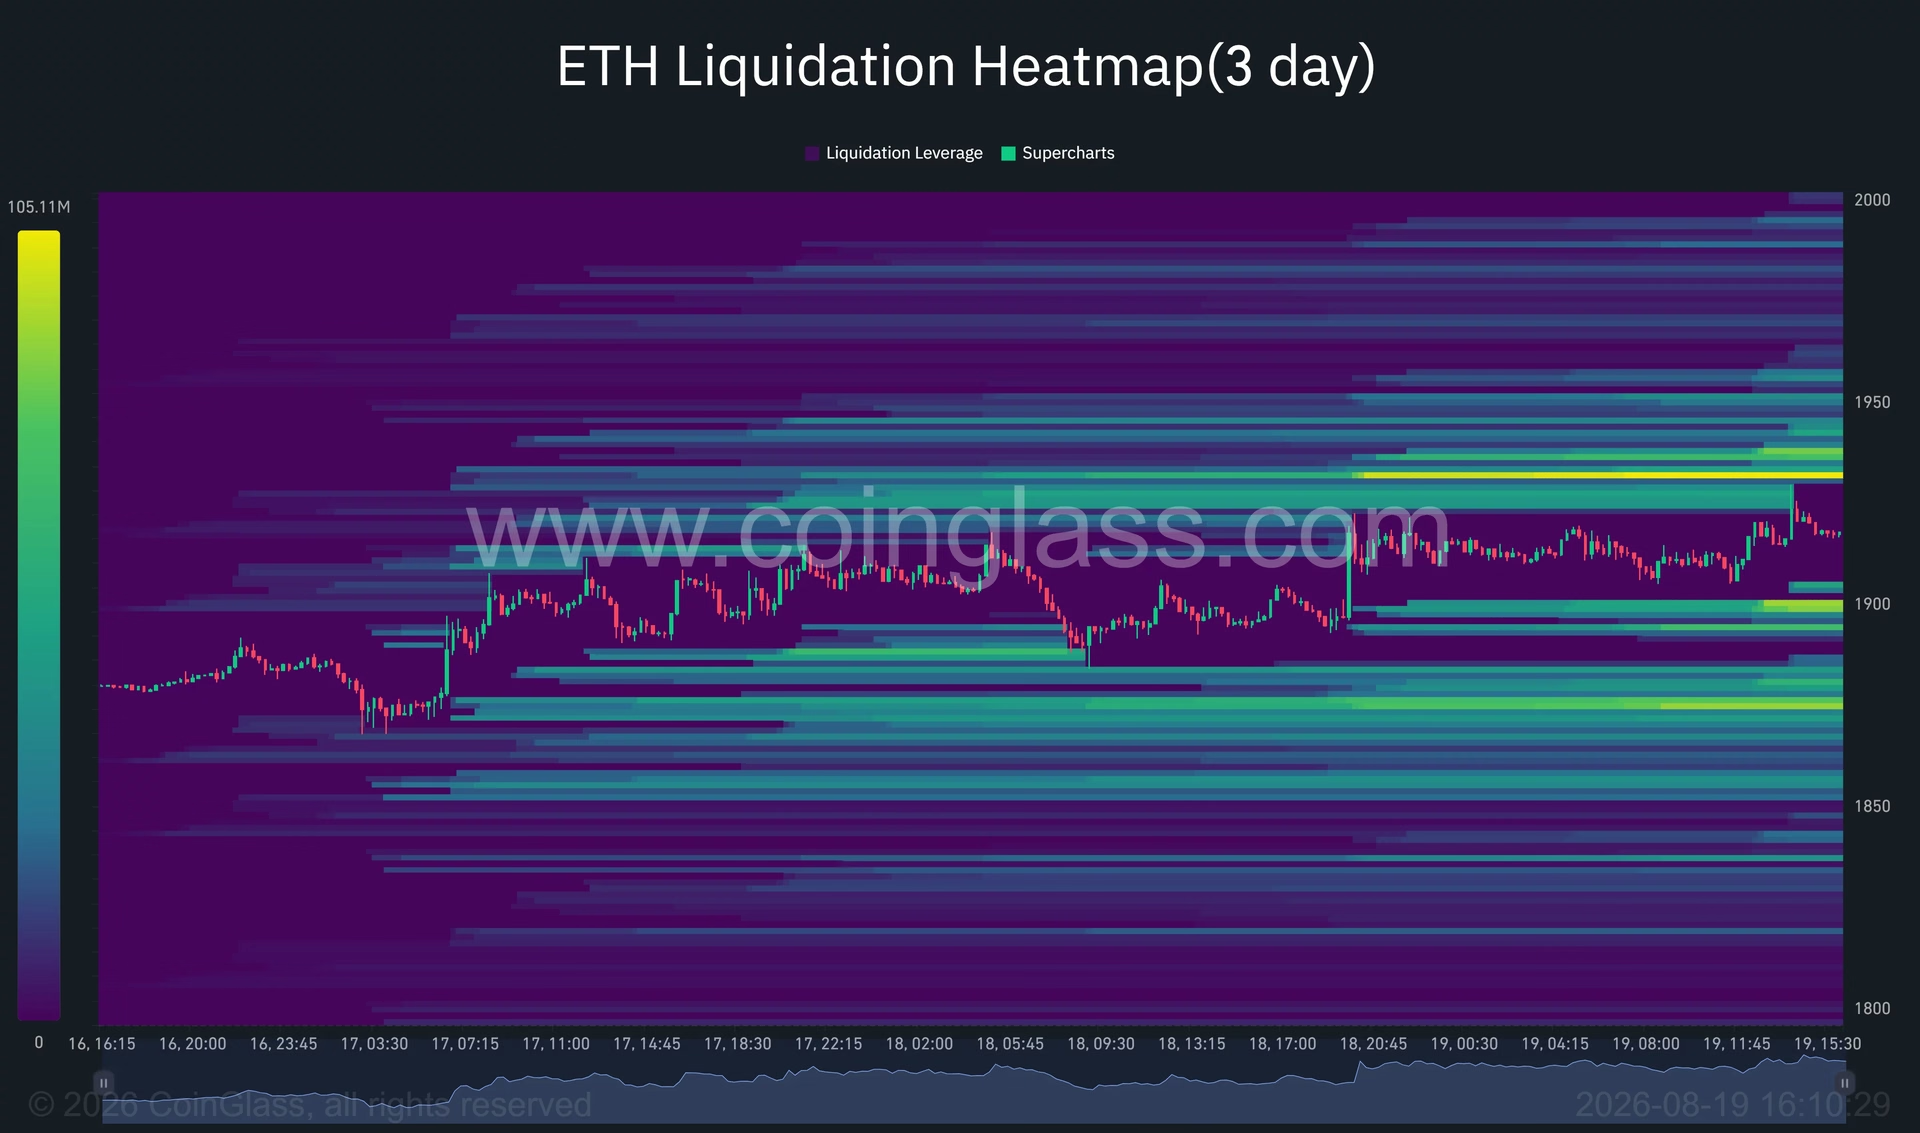
The three-day liquidation heatmap paints a revealing picture of where large leveraged positions cluster around Ethereum's current price. Understanding these zones is crucial because price often gravitates toward areas containing heavily leveraged positions—either to liquidate them or to find support.
The most significant overhead concentration sits near $1,930, with additional liquidation liquidity extending through the $1,940-$1,960 range. A successful push above $1,930 could trigger short liquidations, potentially propelling Ethereum toward the larger cluster around $1,950.
The downside also features substantial liquidation pockets that warrant attention:
- $1,900: The first significant support zone
- $1,865-$1,880: A broader and brighter concentration of leverage
- $1,850: A critical psychological support level
This distribution creates a volatile trading environment where Ethereum remains caught between two nearby liquidity zones. Breaking $1,930 would favor an attempt at $1,950 and then $1,986, while rejection could pull the price back toward $1,900 relatively quickly.
The Bitcoin Correlation Factor 🔗
Ethereum's performance against Bitcoin has emerged as a critical variable in determining whether this rally represents genuine strength or merely participation in a broader crypto market recovery. Prominent crypto analyst Michaël van de Poppe highlighted that Ethereum had delivered a strong bounce against Bitcoin, potentially moving above 0.03205 BTC in coming weeks.
This ETH/BTC dynamic matters significantly because it distinguishes between two scenarios:
- Ethereum Outperformance: Capital rotating from Bitcoin into larger altcoins would support the dollar pair and suggest genuine strength
- Correlated Recovery: Ethereum simply rising alongside Bitcoin without establishing relative strength would suggest limited upside potential
If Ethereum strengthens against Bitcoin while also appreciating in dollar terms, it would signal that market participants are actively choosing to hold altcoin exposure—a bullish development for ETH price prospects.
Fundamental Catalysts Supporting the Recovery 💡
Beyond technical analysis, several fundamental factors could support Ethereum's price trajectory if market conditions remain favorable:
- ETF Demand: Continued institutional interest through spot Ethereum funds could provide steady bid support
- Staking Activity: Growing participation in Ethereum staking demonstrates long-term confidence in the ecosystem
- Layer-2 Expansion: Increased activity on scaling solutions like Arbitrum and Optimism expands the network's utility
- On-Chain Usage: Rising transaction volumes and smart contract activity strengthen the fundamental narrative
These factors create a compelling bull case, but they require market liquidity and risk appetite to remain intact. In risk-off environments, even strong fundamentals struggle to support price appreciation.
Breakout or Bull Trap? The Critical Question 🤔
The central question facing Ethereum traders remains unresolved: does the current recovery represent the beginning of a sustained uptrend, or does it constitute another false breakout that will ultimately resolve lower?
The bullish case hinges on several factors aligning:
- Ethereum establishing support above $1,850
- Breaking through the $1,986-$2,000 resistance zone with conviction
- Momentum indicators accelerating rather than diverging
- Trend strength improving from its current weak levels
- ETH/BTC outperformance gaining traction
The bearish scenario involves:
- Rejection at the $1,930 liquidation cluster
- Pullback toward $1,900 and potentially $1,873
- Continued low trend strength keeping volatility contained
- Capital returning to Bitcoin rather than rotating into altcoins
- Broader macro conditions deteriorating
What Traders Should Monitor Going Forward 👀
For traders evaluating Ethereum's next move, several critical levels and signals deserve attention:
Immediate Support: A hold around $1,850 would be considered constructive, preserving the recovery structure and keeping the broader uptrend intact.
Breakout Confirmation: A close above $1,986-$2,000 with expanding volume and improving trend strength would represent genuine breakout confirmation rather than another consolidation bounce.
Risk Management: Positions should be sized accordingly, recognizing that liquidation clusters near $1,930 and $1,900 create natural volatility zones.
Macro Considerations: For US traders particularly, the directional move may depend on whether capital returns to risk assets broadly and whether regulated spot Ethereum funds attract stronger institutional demand.
The Bottom Line: Patience Required 🎯
Ethereum's current position exemplifies the challenging environment facing cryptocurrency markets. Technical indicators flash bullish signals, fundamental narratives appear constructive, and recovery momentum has established itself. Yet weak trend strength and persistent resistance create genuine uncertainty about whether this rally will extend or resolve lower.
Until Ethereum closes decisively above $1,986-$2,000 with greater trend strength and sustained momentum, the latest gain remains a recovery inside a wider range rather than a confirmed breakout. This distinction matters enormously for positioning and risk management.
The coming days and weeks will likely determine whether Ethereum breaks through psychological resistance or falls back into consolidation. Market participants would be wise to monitor the key technical levels identified, track liquidation clusters, and watch for signs of improving trend strength before committing significant capital to directional positions.
The breakout or bull trap question will answer itself soon enough—but until then, selective positioning and disciplined risk management remain prudent strategies for navigating Ethereum's uncertain near-term trajectory.
You May Also Like

Market Analysis
XRP Price Falls 5% as Leverage Hits Seven-Month High
August 26, 2026

Market Analysis
Crypto Market Hits Extreme Greed: What This Means for Bitcoin
August 26, 2026

Market Analysis
Ethereum Price Rally Overheats Below $2,550 Resistance
August 26, 2026

Market Analysis
Hyperliquid Price Rally: HYPE Targets $97 Amid $80 Support
August 25, 2026