Category:
Market AnalysisHYPE Price Rebound: $60 Target Back in Play 🚀

The cryptocurrency market has witnessed a compelling recovery narrative unfold with HYPE's recent price action, as the token rebounds from critical support levels and charts a potential path toward the psychologically significant $60 mark. This technical resurgence comes amid strengthening capital flows and renewed investor optimism, signaling that the worst of the recent decline may be behind us.
HYPE's Remarkable Recovery from the $51 Support Zone 📈
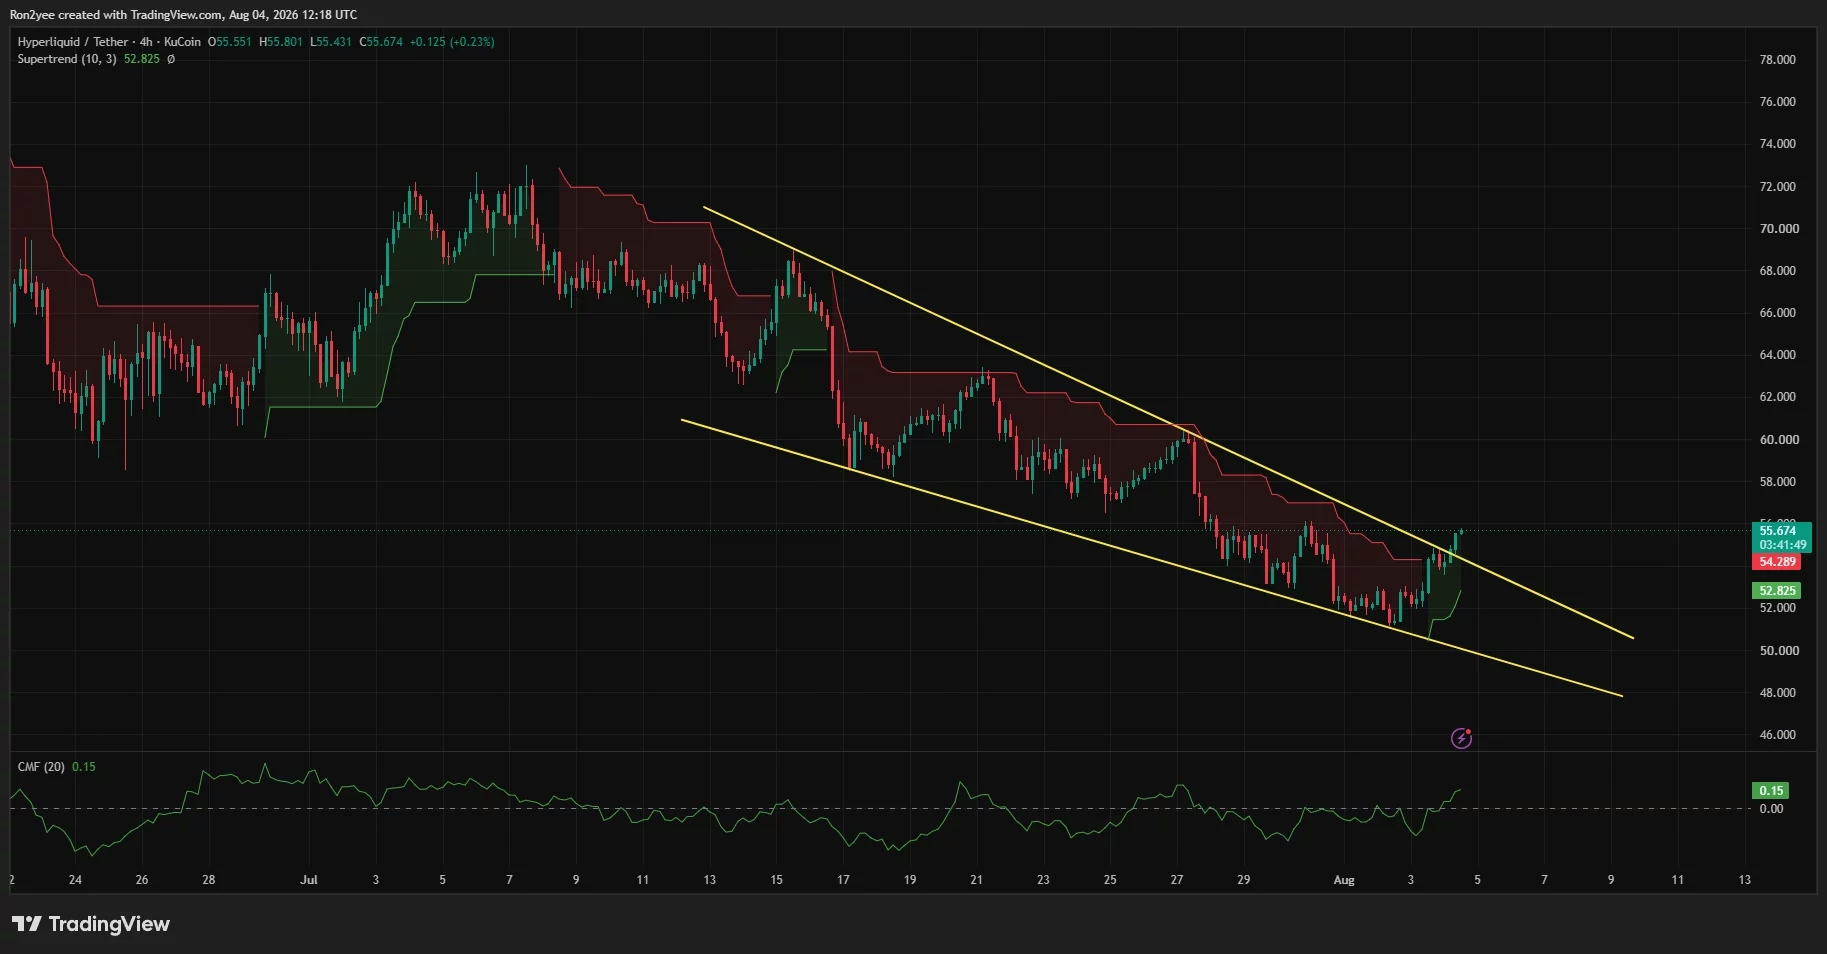
After defending crucial support near $51, HYPE demonstrated impressive resilience by climbing approximately 8.2% to trade around $55.60 on August 4th. This recovery represents more than just a temporary bounce—it signals a potential shift in market sentiment following an extended downtrend that had persisted since July's highs above $72.
The token's ability to hold at the $51 support level proved instrumental in establishing a foundation for this rebound. Support zones often act as psychological barriers where institutional buyers and long-term holders accumulate positions, and HYPE's defense of this area attracted sufficient buying pressure to initiate the recovery phase.
Breaking Through the Descending Channel: A Technical Turning Point 🔄
One of the most significant developments in HYPE's technical setup has been the breakout above a descending channel that had confined price action since mid-July. This channel, characterized by progressively lower highs and lower lows, typically represents a bearish consolidation pattern—until it breaks.
On the 4-hour timeframe, buyers successfully pushed HYPE through the channel's upper boundary, marking a critical inflection point. This breakout coincided with the token reclaiming the 4-hour Supertrend level at $54.29, which had been acting as resistance. The Supertrend indicator, known for its reliability in identifying trend reversals, turned bullish for the first time since the latest decline began—a development that technical analysts view as a meaningful confirmation of strengthening momentum.
The Chaikin Money Flow (CMF) indicator rose to 0.15 alongside this breakout, a positive reading that distinguishes organic buying pressure from volume-driven rallies. When CMF remains positive, it indicates that institutional and retail buyers are accumulating positions with conviction, rather than the price rising on thin trading conditions or speculative excitement alone.
Understanding HYPE's Resistance Levels and the Path to $60 🎯
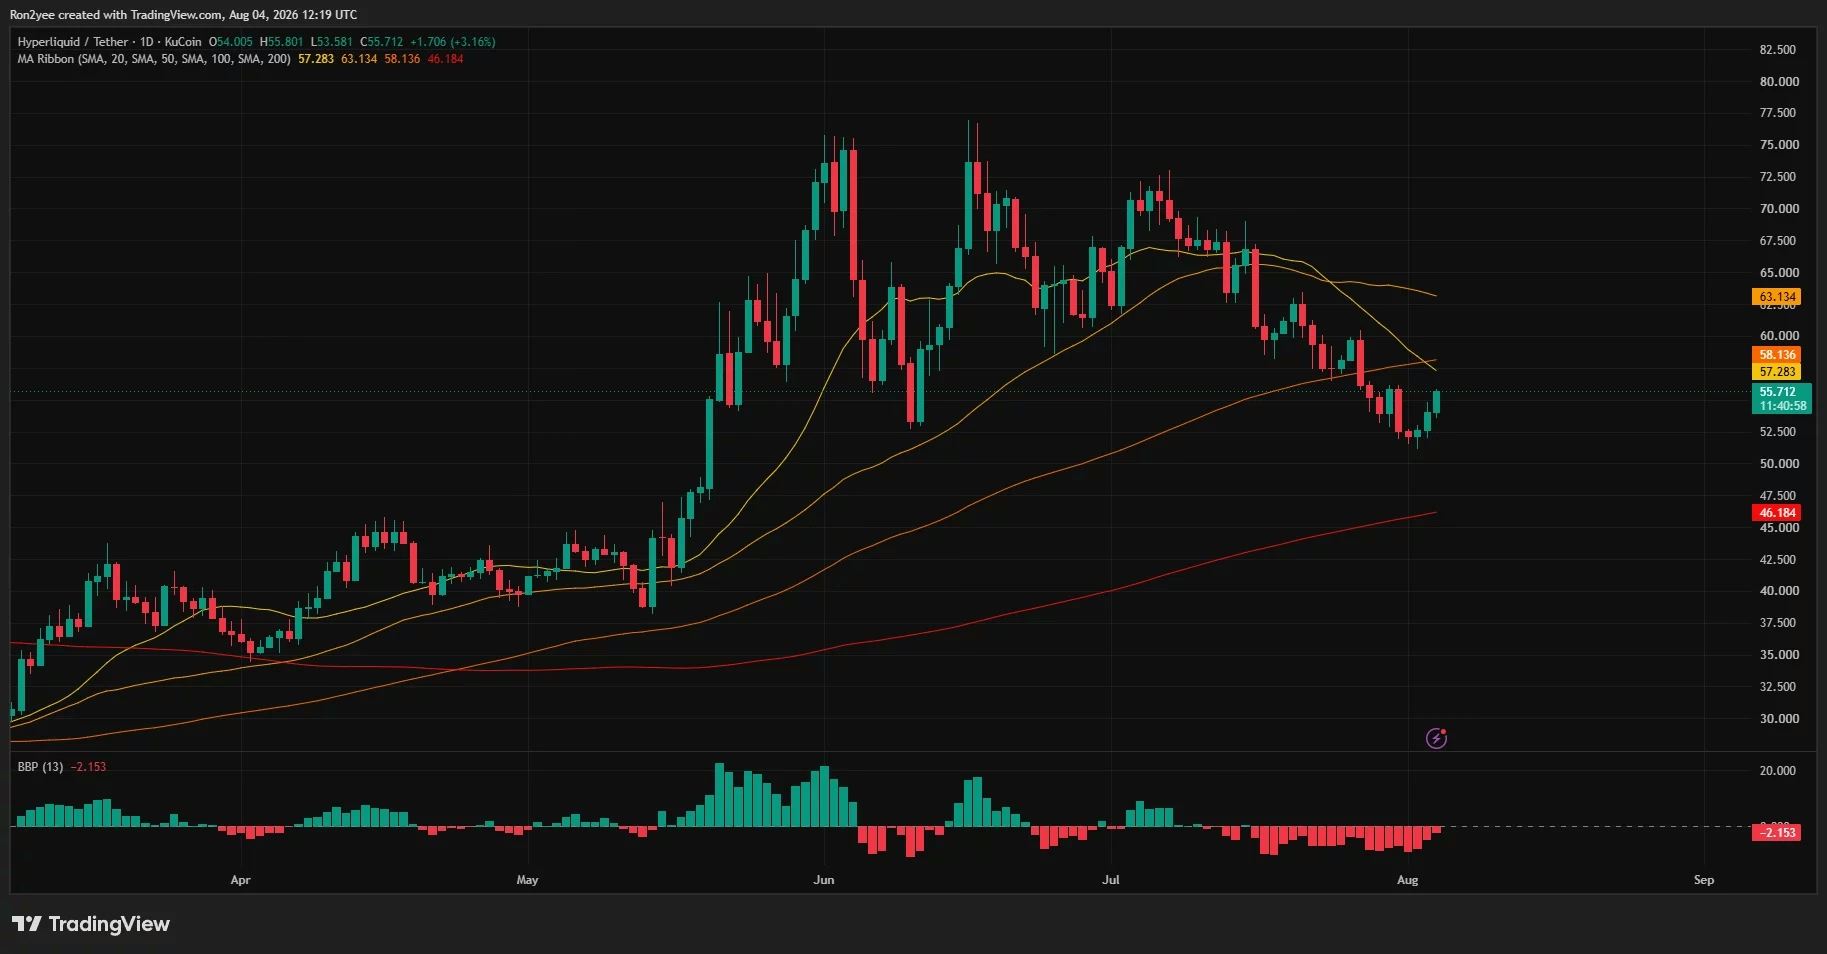
While the breakout is encouraging, HYPE must navigate several resistance zones before reaching the $60 psychological level. The daily chart reveals a critical resistance cluster between $57.28 and $58.14, created by the convergence of the 50-day and 100-day simple moving averages.
Moving averages serve as dynamic support and resistance levels that reflect the average price over specific periods. When multiple moving averages cluster together, they create zones where profit-taking typically accelerates and where traders reassess their positions. Breaking through this narrow band would represent a significant achievement and would expose the $60 level as the next natural target.
Beyond $60, the 200-day moving average sits near $63.13, representing the next major structural resistance where longer-term profit-taking could intensify. This multi-layered resistance structure means that reaching $60 would require sustained buying pressure and continued positive technical developments.
The Liquidation Heatmap: Volatility Catalysts Ahead ⚡
One of the most revealing aspects of modern cryptocurrency trading is the visibility into leveraged liquidation levels through platforms like CoinGlass. HYPE's one-week liquidation heatmap reveals substantial clusters of leveraged liquidity immediately above current price levels, particularly concentrated around $56.20–$56.40 and another major band near $56.80–$57.00.
These liquidation clusters represent positions that will automatically close if prices rise to those levels, creating a self-reinforcing mechanism. When short positions liquidate, the automatic buy orders generated by exchanges can accelerate upward price movement—a phenomenon known as a short squeeze. This dynamic could provide the catalyst needed to push through the $57.28–$58.14 resistance zone more decisively.
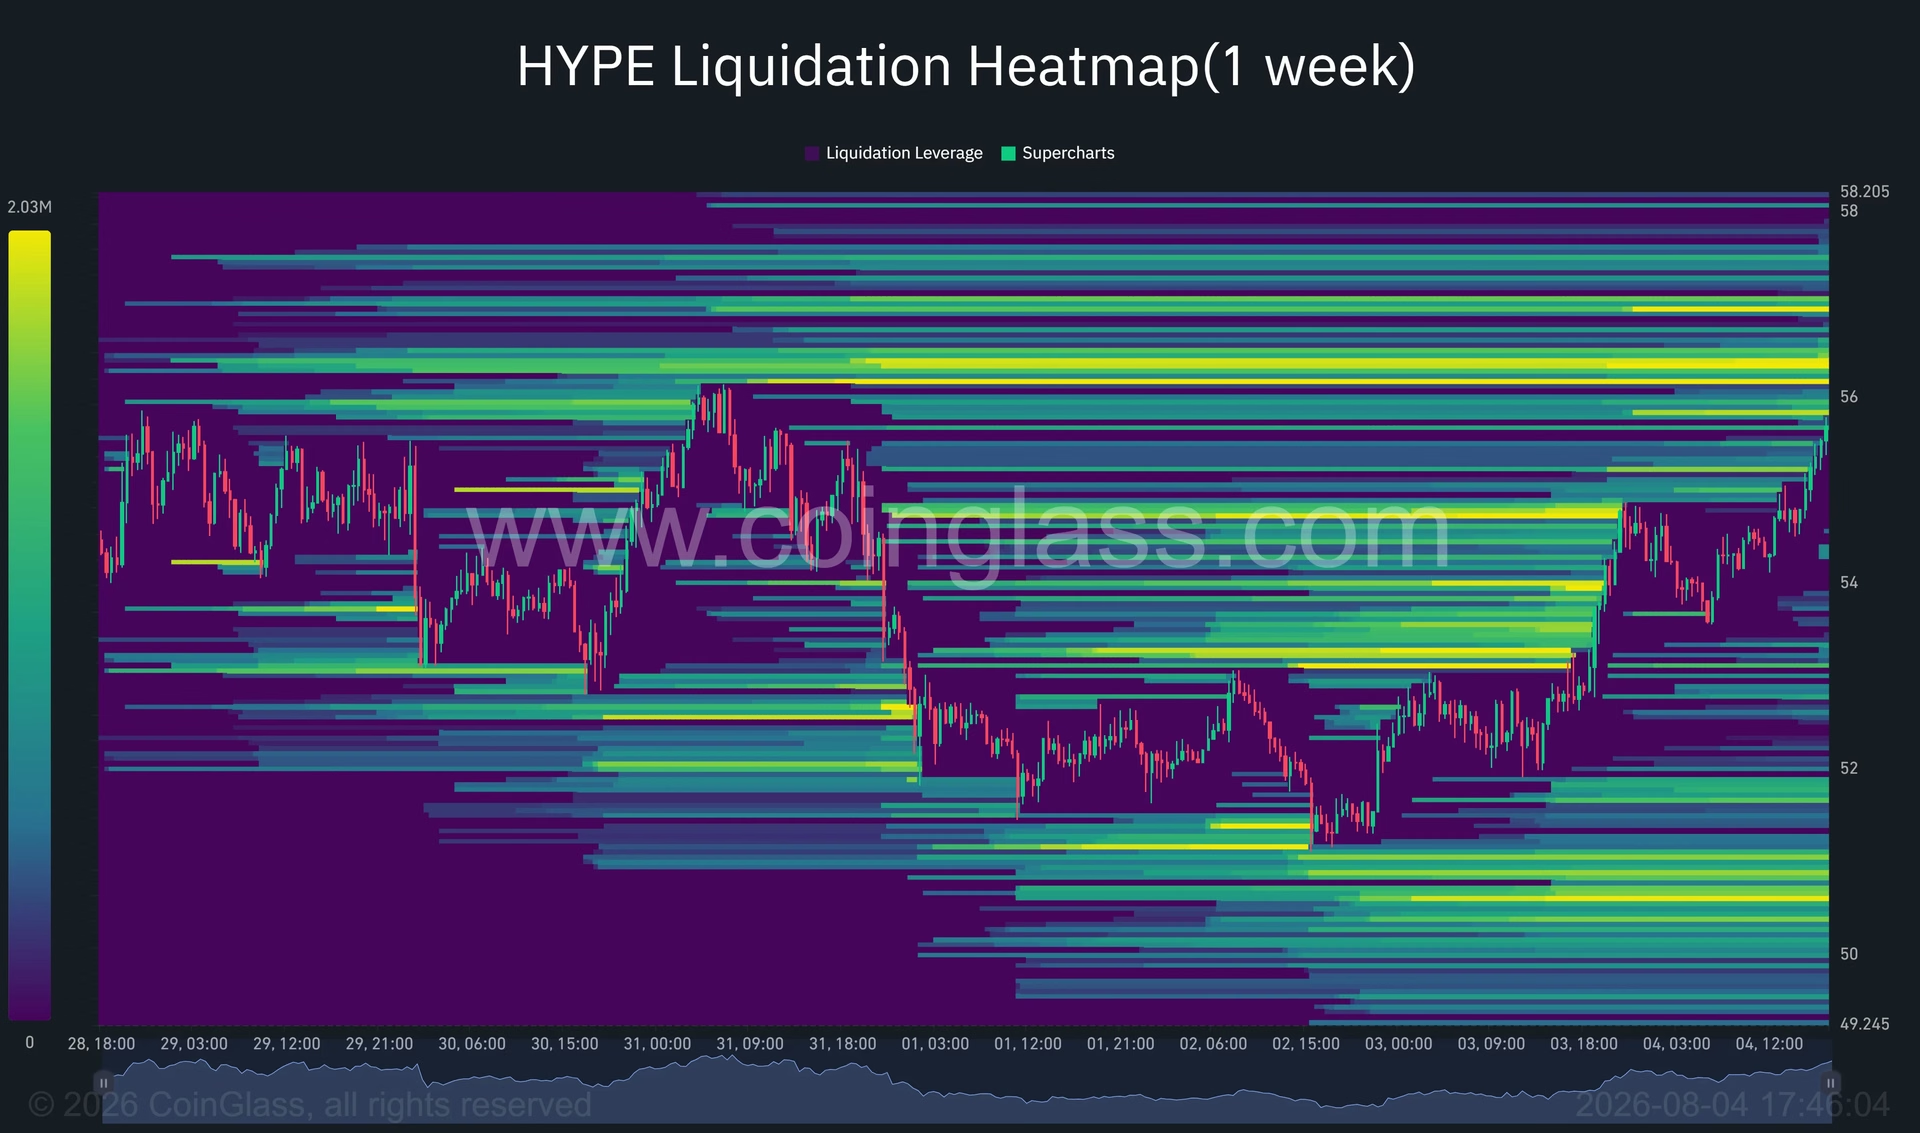
However, liquidation maps identify potential volatility zones rather than guaranteed price targets. The actual impact depends on the size of positions, the speed of price movement, and broader market conditions. Downside liquidation liquidity is visible around $53 and between $50.50–$51.00, meaning that a failed breakout could accelerate a return to those levels through long liquidations.
Fundamental Support: Fee-Funded Buybacks and Platform Revenue 💰
Beyond technical factors, HYPE's recovery is supported by genuine fundamental developments within the Hyperliquid ecosystem. The protocol's fee-routing structure directs most platform revenue toward recurring token purchases on the open market, creating consistent demand that supports price stability during uncertain periods.
Trailing gross revenue has reached approximately $1.34 billion, demonstrating substantial user activity and exchange volume. During the latest session alone, Hyperliquid processed more than $30.44 million in large orders involving actively traded assets, indicating robust institutional participation and trading velocity.
This fee-funded buyback mechanism differs fundamentally from price support driven by external factors. It represents genuine economic demand generated by the platform's operational success, creating a structural floor beneath the token's valuation.
Expanding Use Cases: Prediction Markets and Token Locking Mechanisms 🔐
Hyperliquid's expanded prediction and outcome market system introduces another layer of fundamental support for HYPE's valuation. Deployers creating permissionless public markets must lock at least 500,000 HYPE tokens, representing approximately $27.8 million at current prices.
This locking requirement could temporarily remove substantial quantities of tokens from liquid circulation if adoption of prediction markets accelerates. However, it's important to note that this mechanism doesn't guarantee sustained price appreciation—the effect depends entirely on the number of markets created and how long deployers maintain their locked positions. If market creation slows or deployers withdraw their locked tokens, the supply pressure could reverse.
Still, the growing number of use cases for HYPE within the Hyperliquid ecosystem represents a structural shift toward genuine utility beyond pure speculation.
Market Context: Altcoin Headwinds and Regulatory Uncertainty 🌍
HYPE's recovery occurs within a challenging broader altcoin market environment characterized by weak liquidity and significant regulatory uncertainty in the United States. Delays surrounding crypto market-structure legislation have created a wait-and-see dynamic among traders, particularly those focused on decentralized trading platforms.
Regulatory clarity remains one of the most significant catalysts for sustained altcoin strength. Until clearer rules governing decentralized platforms emerge from US regulators, many institutional participants remain cautious about substantial position increases. This regulatory overhang means that HYPE's recovery, while technically impressive, occurs against headwinds that could reassert themselves if broader market sentiment deteriorates.
Critical Support and Downside Scenarios ⚠️
For the recovery narrative to remain intact, HYPE must hold above the former channel resistance and the $54.00–$54.30 region. A decisive break below $54.29 would suggest that the breakout failed and would raise the risk of returning to $52.83, the current Supertrend support level.
If $52.83 fails to hold, the $51 support zone would face renewed testing. A close below $51 would invalidate the channel breakout entirely and expose $49.25 as the next downside target. The daily 200-period exponential moving average near $46.18 would provide deeper structural support but would represent a significantly extended decline from current levels.
This layered support structure gives traders multiple reference points for assessing whether the recovery remains valid or has failed.
What Traders Should Monitor Going Forward 👀
The immediate outlook for HYPE depends on whether buyers can accomplish two critical objectives:
First, turn $54.30 into a reliable support level that holds during normal pullbacks. This would confirm that the breakout has genuine staying power.
Second, clear the $57.28–$58.14 moving-average resistance cluster. A daily close above $58.14 would strengthen the bullish reversal case significantly and expose the $60 psychological level as the next natural target.
The Bollinger Band Pressure (BBP) indicator remains negative at -2.153 on the daily timeframe, indicating that bearish pressure hasn't completely disappeared. However, its histogram has begun moving toward zero, suggesting that sellers are gradually losing control. This gradual shift in momentum, combined with the technical breakout and positive CMF readings, creates a scenario where the probability of reaching $60 has increased materially.
The $60 Target: Achievable but Not Guaranteed 🎪
While HYPE's recent rebound has placed the $60 level back within technical reach, achieving that target requires sustained buying pressure and the absence of negative catalysts from the broader market. The token must navigate multiple resistance zones, maintain support above critical technical levels, and benefit from continued operational success within the Hyperliquid ecosystem.
The combination of technical breakouts, positive capital flows, liquidation-driven short squeezes, and fundamental support from fee-funded buybacks creates a compelling case for continued recovery. However, the regulatory uncertainty hanging over altcoin markets and the need for HYPE to prove it can hold support above $54.30 mean that this recovery remains conditional rather than assured.
Traders and investors should monitor price action at the $54.30–$54.00 support zone closely, as a break below this area would suggest the recovery has failed. Conversely, a sustained hold above $54.30 followed by a push through the $57.28–$58.14 resistance cluster would significantly increase the probability of the $60 target being achieved in the near term. 🚀
You May Also Like

Market Analysis
XRP Price Falls 5% as Leverage Hits Seven-Month High
August 26, 2026

Market Analysis
Crypto Market Hits Extreme Greed: What This Means for Bitcoin
August 26, 2026

Market Analysis
Ethereum Price Rally Overheats Below $2,550 Resistance
August 26, 2026

Market Analysis
Hyperliquid Price Rally: HYPE Targets $97 Amid $80 Support
August 25, 2026