Category:
Market AnalysisHyperliquid Price Breakout: $84 Liquidity Zone in Focus

🚀 Hyperliquid Surges to New Heights, But $84 Resistance Looms Large
The cryptocurrency market has witnessed remarkable momentum across multiple digital assets in recent weeks, and Hyperliquid (HYPE) has emerged as one of the standout performers. After reaching an impressive all-time high of $83.27 in late August, the token has captured significant attention from traders and investors alike. Currently consolidating near $80, HYPE presents a fascinating case study in how platform fundamentals, liquidity dynamics, and technical resistance levels interact to shape price discovery in emerging blockchain ecosystems.
The recent rally has been nothing short of extraordinary. Over a seven-day period, HYPE demonstrated a 32.3% gain, with monthly appreciation reaching 35.8%. This surge has propelled Hyperliquid's market capitalization to approximately $17.8 billion, positioning it among the top ten cryptocurrencies globally. 📈 However, beneath these impressive numbers lies a more nuanced story about what's driving demand and where potential challenges may emerge.
📊 Understanding the Breakout: From $60 to $83 in Days
The acceleration phase began dramatically on August 19, when HYPE climbed from below $60 to nearly $70 in a single trading session. This explosive move caught many market participants off-guard and signaled the beginning of a sustained rally. Over the subsequent four days, buyers demonstrated remarkable conviction, pushing the token through $75 and above $80 before reaching the $83.27 peak.
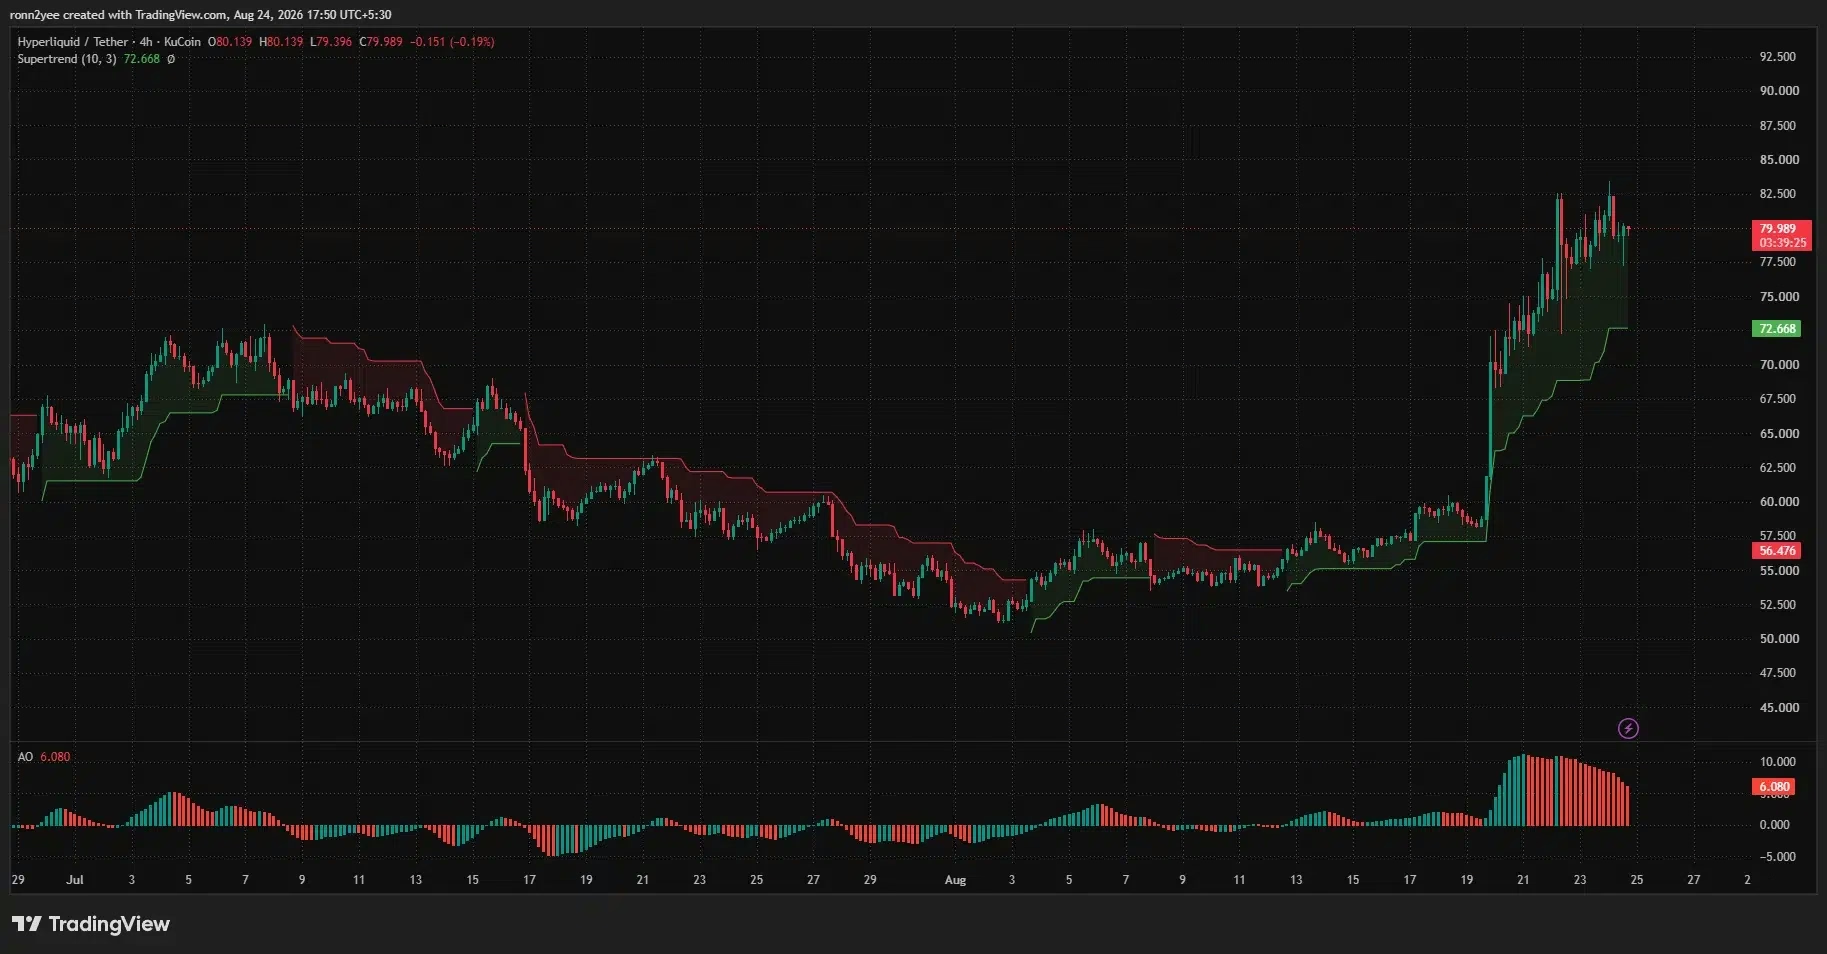
What's particularly noteworthy is the consistency of this advance. Rather than exhibiting the typical volatile, choppy behavior associated with speculative rallies, HYPE maintained relatively steady momentum throughout the period. This suggests underlying support from both fundamental improvements and growing user adoption. The price consolidation below the record high, hovering near $80, indicates that buyers have retained control despite profit-taking attempts. 💪
💰 Platform Fees: The Unsung Hero Behind HYPE Demand
One of the most compelling aspects of Hyperliquid's bullish case lies in its fee generation mechanism. During a recent 24-hour period, the protocol generated an impressive $6.5 million in fees—significantly outpacing competitors like Pump.fun, which generated $1.5 million during the same timeframe. Over the past 30 days, Hyperliquid accumulated $55.64 million in total fees, with $40.94 million flowing to protocol revenue.
What makes this particularly significant is how these fees translate into ongoing demand for HYPE tokens. The Hyperliquid protocol directs 99% of perpetual and spot trading fees (excluding certain builder fees) to the Assistance Fund, which executes open-market purchases of HYPE. This creates a powerful virtuous cycle: increased trading activity generates higher fees, which automatically increase demand for the token itself. 🔄
During the recent surge, the platform recorded approximately 102,800 daily active users, with the heightened leveraged trading activity during the broader cryptocurrency market rally driving fee generation. This organic demand mechanism provides a fundamental foundation for HYPE's price appreciation that extends beyond pure speculation.
🎯 Technical Analysis: Overbought Conditions and Key Resistance Levels
While the fundamentals appear supportive, technical indicators suggest caution in the near term. The daily Relative Strength Index (RSI) reached 75.91—well above the conventional overbought threshold of 70. This elevated reading indicates that the rally has become stretched and potentially vulnerable to profit-taking or consolidation.
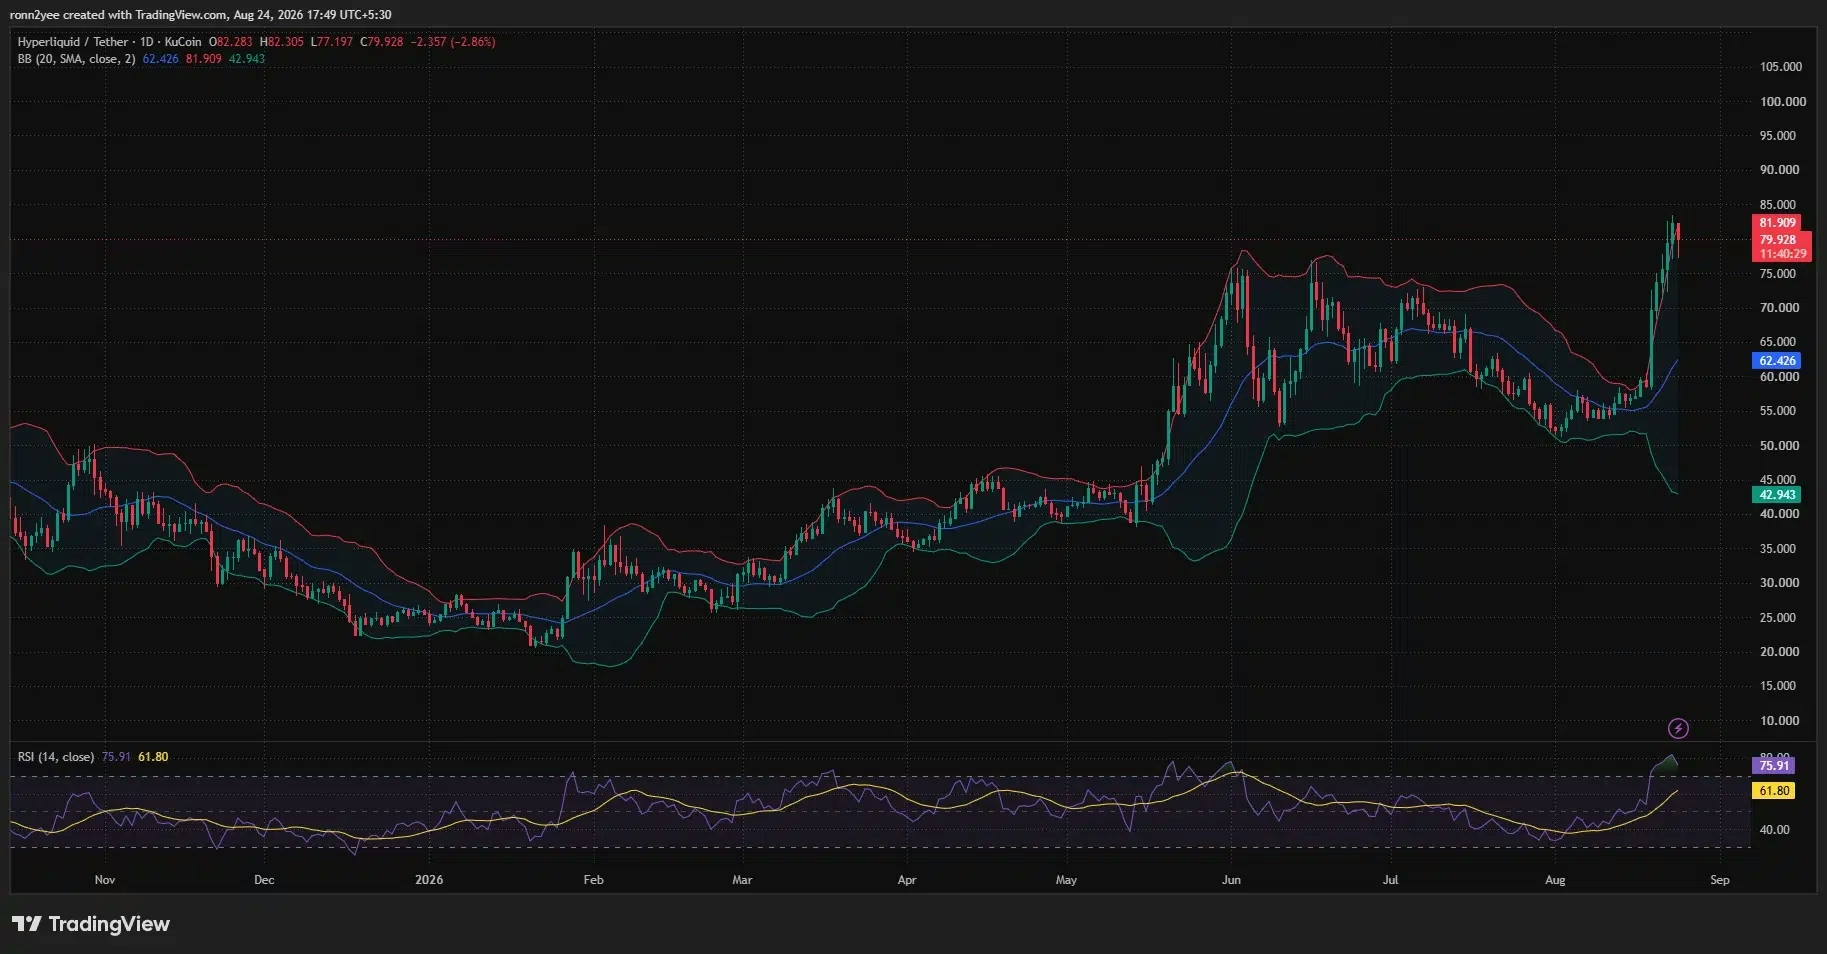
On the daily chart, HYPE traded above the upper Bollinger Band at $81.91 before pulling back slightly. The middle band (20-day simple moving average) sits at $62.43, emphasizing how dramatically price has moved above its short-term equilibrium. The Awesome Oscillator remains positive at 6.08, but its histogram has declined from local peaks, suggesting that bullish momentum is present but no longer accelerating at the rapid rate witnessed during the initial breakout. ⚠️
The 4-hour Supertrend level at $72.67 provides critical support for maintaining the current bullish structure. A decisive break below this level would weaken the technical setup and potentially reopen focus on the previous breakout area around $68-$70.
🔥 The $84 Liquidity Cluster: Where the Real Battle Awaits
Liquidation data reveals a fascinating dynamic that could shape near-term price action. According to three-day CoinGlass liquidation heatmaps, the strongest concentration of leveraged positions clusters around the $84 level. This represents the immediate resistance zone that HYPE must overcome to unlock further price discovery.
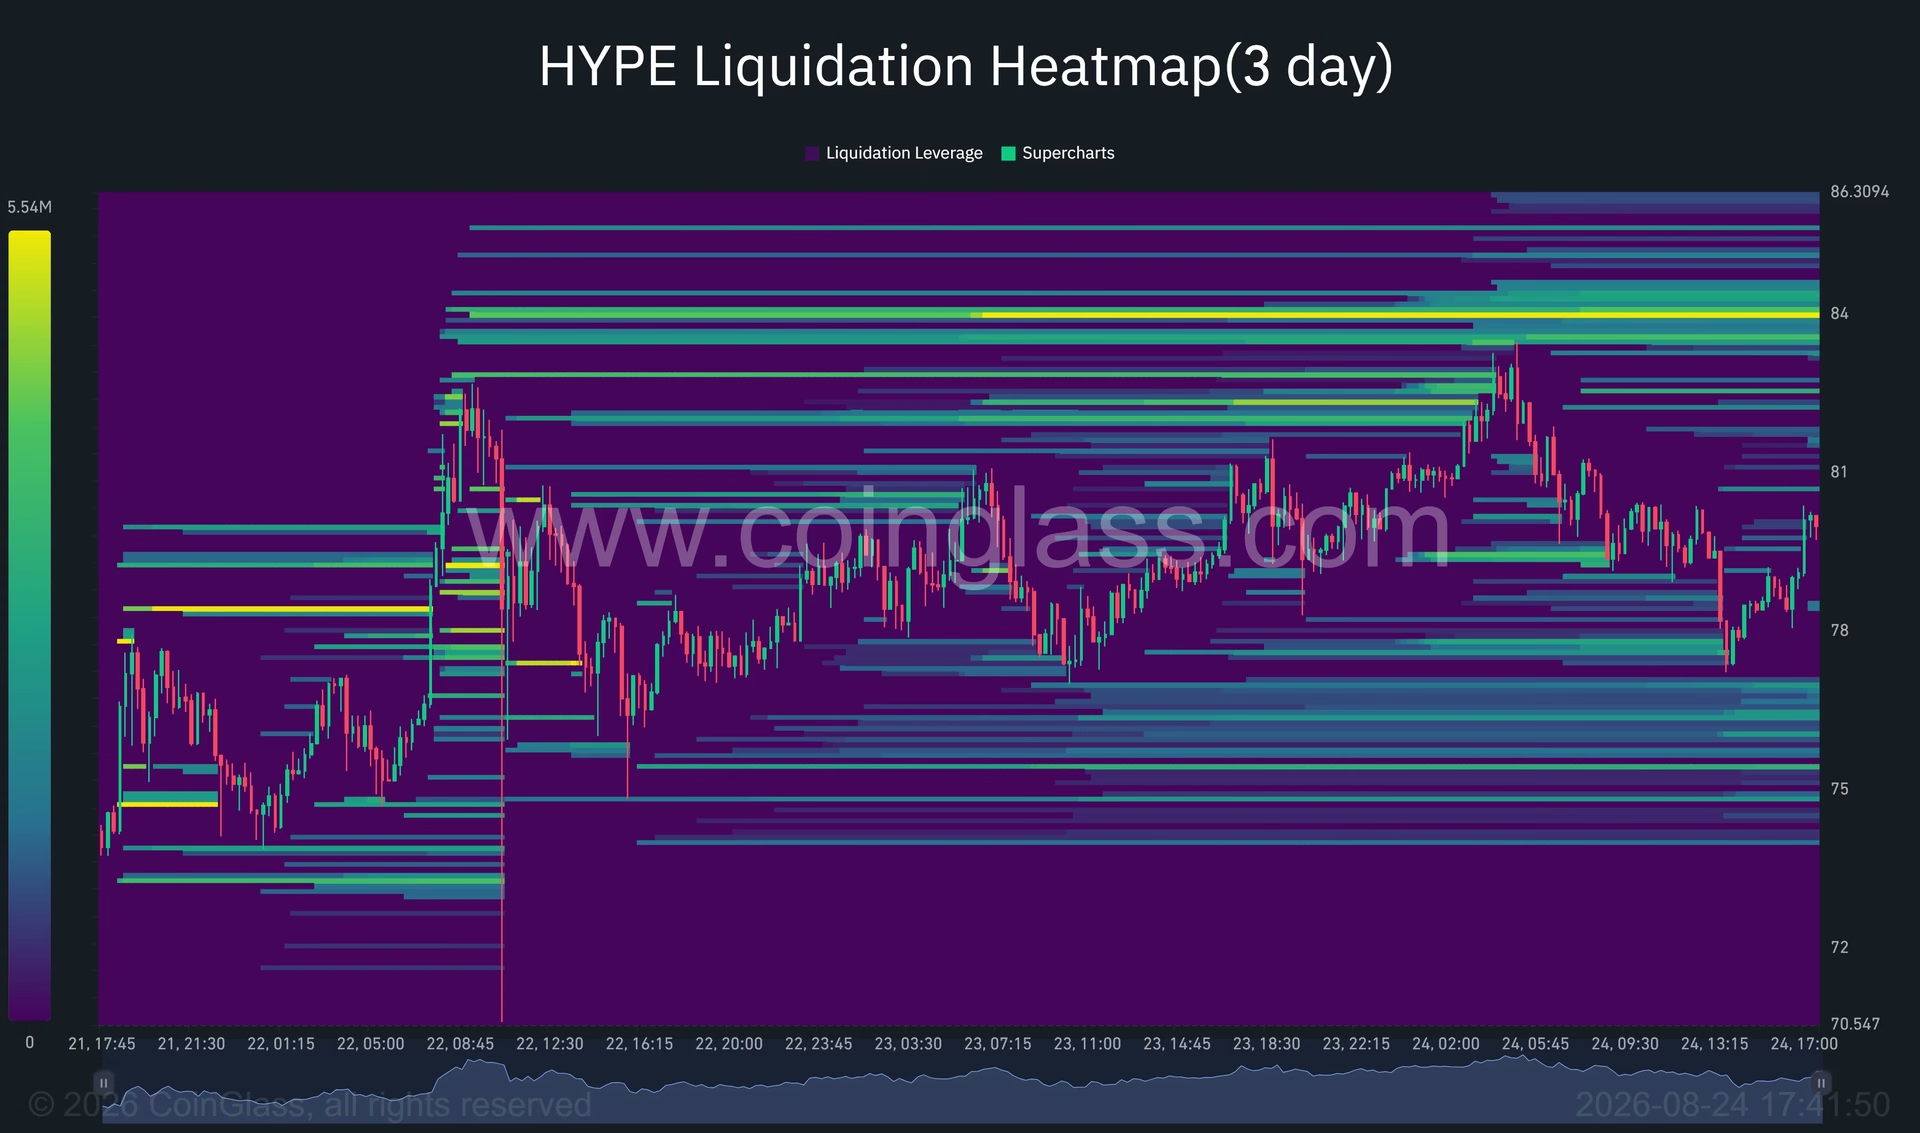
A clean break above $84 could trigger short liquidations, creating additional buying pressure and potentially reopening aggressive price discovery. The next visible upper boundary sits at $86.30, with the psychological $90 level representing another potential resistance area. However, if HYPE fails to clear $84, the immediate support zone lies between $78-$79, with another notable concentration of positions near $77. 📍
A deeper correction could extend toward the 4-hour Supertrend at $72.67, and losing that level would raise the risk of returning to the $68-$70 breakout origin point. Understanding these liquidity clusters is essential for traders positioning themselves for either continuation or reversal scenarios.
🏗️ HIP-3 Framework: Building the Next Generation of Derivatives Markets
Beyond immediate price dynamics, Hyperliquid's fundamental growth story centers on the HIP-3 proposal, which enables builders to deploy their own perpetual futures markets on the platform. This framework represents a significant evolution in how decentralized derivatives platforms can scale.
Under the HIP-3 structure, market deployers must stake 500,000 HYPE tokens and operate markets with independent order books, margin rules, and customized settings. This requirement creates ongoing demand for HYPE tokens from builders seeking to launch their own markets. The framework has expanded Hyperliquid's scope beyond cryptocurrency derivatives to include products linked to commodities, equities, and foreign exchange pairs. 🌍
Currently, activity remains concentrated among a limited number of major deployers, but continued expansion in this area could provide substantial long-term support for HYPE valuations. The ability to create diverse derivative markets attracts institutional participants and increases the platform's utility beyond its original crypto-focused mission.
📈 Volume Dynamics and the Path to $100 Million
Trading volume represents a critical metric for validating the sustainability of HYPE's rally. Market observers have noted that while price has held near record levels, volume has eased following the initial surge. This pattern suggests potential vulnerability if volume doesn't expand to confirm the breakout.
Pseudonymous traders monitoring the situation suggest that HYPE appears to be approaching another potential breakout candle, with trading volume potentially approaching $100 million becoming increasingly likely. The bullish scenario requires HYPE to close decisively above $84 with rising spot volume, invalidating the immediate rejection and targeting $86.30, followed by the psychological $90 level. 🎯
Conversely, the bearish scenario begins with a loss of the $77 support level. Breaking below that threshold could trigger long liquidations and expose lower support near $75, followed by the Supertrend support near $72.67. Volume confirmation will be essential in determining which scenario unfolds.
🇺🇸 Regulatory Considerations: The U.S. Access Question
One significant uncertainty for Hyperliquid's long-term outlook involves regulatory access for United States-based participants. While Hyperliquid's Policy Center indicates advocacy efforts for establishing a legal route allowing Americans to access decentralized markets, no official White House or CFTC announcements confirming platform integration into the U.S. market have been published.
This regulatory ambiguity could represent either a headwind limiting adoption or an upcoming catalyst if clarity emerges. The resolution of this issue could meaningfully impact HYPE's valuation trajectory, particularly if institutional capital from the United States begins accessing the platform. 🏛️
🎬 Key Takeaways: What Traders Should Monitor
Hyperliquid's current positioning presents a compelling intersection of technical, fundamental, and liquidity considerations:
- Immediate Resistance: The $84 liquidity cluster represents the critical near-term resistance that will determine whether price discovery continues or consolidation begins
- Fundamental Support: Fee generation mechanisms creating automatic HYPE demand provide a foundation extending beyond pure speculation
- Technical Caution: Overbought indicators suggest elevated vulnerability to profit-taking, though the bullish structure remains intact
- Volume Confirmation: The bullish case strengthens significantly if volume expands toward $100 million while price holds above $84
- Support Levels: The $77-$78 zone and 4-hour Supertrend at $72.67 provide critical support boundaries for risk management
- Long-Term Catalyst: HIP-3 framework expansion and potential U.S. regulatory clarity could provide additional tailwinds
As Hyperliquid continues its price discovery journey, the interplay between these factors will determine whether the recent breakout represents the beginning of a sustained bull market or a temporary spike destined for consolidation. 🌟 Traders and investors should monitor volume dynamics, liquidity concentration levels, and fundamental developments with equal attention to technical price action.
You May Also Like

Market Analysis
XRP Price Falls 5% as Leverage Hits Seven-Month High
August 26, 2026

Market Analysis
Crypto Market Hits Extreme Greed: What This Means for Bitcoin
August 26, 2026

Market Analysis
Ethereum Price Rally Overheats Below $2,550 Resistance
August 26, 2026

Market Analysis
Hyperliquid Price Rally: HYPE Targets $97 Amid $80 Support
August 25, 2026