Category:
Market AnalysisPeter Brandt Bitcoin $58K Warning: Technical Analysis

Bitcoin's price trajectory has become increasingly scrutinized by technical analysts as the world's leading cryptocurrency navigates a critical juncture. 📊 With the digital asset hovering near the $65,000 mark in mid-August, veteran trader Peter Brandt issued a cautionary assessment that captured market attention—one that warrants careful examination for both seasoned investors and those monitoring crypto market dynamics.
The Head and Shoulders Pattern: Brandt's Technical Blueprint 🎯
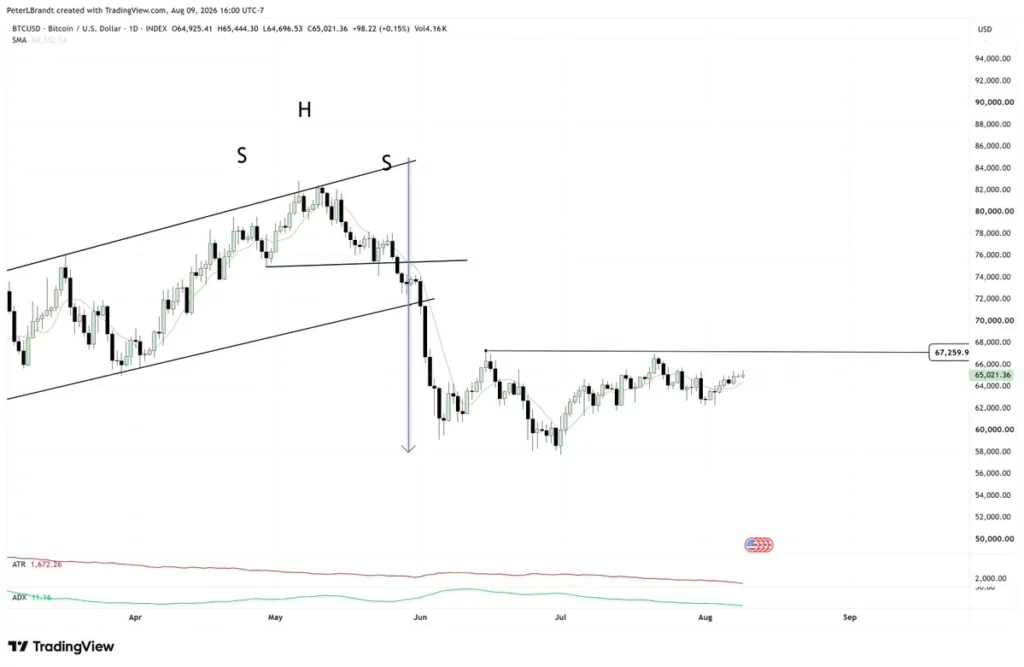
Brandt's bearish outlook centers on a distinctive chart formation that emerged between April and June: a head and shoulders pattern. This classical technical structure represents one of the most reliable reversal signals in market analysis, and its implications for Bitcoin deserve serious consideration.
The pattern's neckline, positioned around $75,000, has already broken to the downside—a development that typically confirms the bearish setup. According to Brandt's technical analysis, if Bitcoin fails to reclaim critical resistance levels, the path could extend toward $58,000. It's important to note that this represents a technical scenario based on chart patterns rather than a guaranteed market forecast.
Understanding Brandt's Cautious Positioning 💭
What makes Brandt's commentary particularly noteworthy is his careful wording. He stated: "I am not in the bet yet, but if I were to bet it would be for a decline." This phrasing reveals an important distinction—he's expressing a directional preference rather than announcing an active short position or making an absolute prediction.
This nuanced approach reflects the professional skepticism that characterizes experienced traders. Rather than declaring certainty, Brandt acknowledges the uncertainty inherent in market analysis while indicating where his technical bias currently leans. The distinction matters because it demonstrates how seasoned market participants evaluate risk without overcommitting to any single narrative.
Resistance Levels: The $67,000 Barrier 📈
Bitcoin's immediate technical challenge involves reclaiming and sustaining movement above $67,260—a level that has proven resistant to sustained breakouts. This resistance zone carries particular significance because it aligns closely with the short-term holder realized price, estimated at approximately $67,523 by onchain analysts.
When Bitcoin approaches these cost basis levels, underwater holders often face decisions about whether to hold or exit positions. This psychological and financial dynamic can influence price action as holders weigh their options. A sustained break above this zone would weaken Brandt's bearish technical setup and suggest a shift toward recovery momentum.
Weakness in Trend Strength: The ADX Signal 🔍
The Average Directional Index (ADX) provides crucial context for understanding Bitcoin's current market condition. At approximately 11.16, this indicator signals weak trend strength—a reading that suggests the market lacks directional conviction. When ADX remains below 20, traders typically recognize that consolidation or sideways movement dominates rather than strong trending action.
Combined with the Average True Range near 1,672, which reflects relatively wide daily price swings, the technical picture reveals a market caught between competing forces. Bitcoin remains above its 54-day simple moving average at $64,352, suggesting some stabilization following June's selloff, yet it hasn't decisively broken through overhead resistance.
Whale Activity: Supply Pressure from Large Holders 🐋
Onchain monitoring platforms have tracked significant selling activity from major Bitcoin holders. One tracked whale reportedly disposed of approximately 7,513 BTC worth roughly $486.9 million across three weeks, including a recent sale of 1,019 BTC valued near $66.4 million. While this activity represents notable supply pressure, it's important to contextualize such data—one whale's actions don't necessarily reflect the broader sentiment among all large holders.
Nevertheless, this selling pressure adds another variable to Brandt's technical thesis. The combination of technical resistance, weak trend indicators, and documented large holder selling creates a scenario where downside pressure remains plausible. However, this supply pressure must be weighed against institutional demand signals.
Institutional Inflows: The Bullish Counterweight 💰
While technical and onchain factors suggest caution, U.S. spot Bitcoin ETFs have demonstrated robust institutional appetite. Between August 3-7, these investment vehicles recorded daily net inflows of $170.1 million, $211.5 million, $244.4 million, $137.6 million, and $101.7 million respectively—totaling approximately $865.3 million across five trading sessions.
This institutional demand represents a significant bullish counterforce to the bearish technical setup. The sustained inflows suggest that despite technical headwinds, professional investors continue accumulating Bitcoin through regulated investment vehicles. This divergence between technical weakness and institutional strength creates an intriguing market dynamic worth monitoring.
The Macro Catalyst: CPI and Employment Data 📊
Bitcoin's near-term price action increasingly depends on macroeconomic developments, particularly inflation metrics and employment data. The July U.S. Consumer Price Index report, released on August 12, provided crucial information for understanding inflation trajectory and potential Federal Reserve policy implications.
Recent employment data added complexity to the macro picture. July nonfarm payrolls fell by 23,000, while May and June figures were revised downward by a combined 103,000 jobs. These softer employment metrics, combined with inflation trends, could influence both traditional markets and cryptocurrency valuations.
Critical Support and Resistance Zones 🎲
The technical landscape presents several key levels investors should monitor:
- $67,260-$67,523: Resistance zone aligning with short-term holder cost basis
- $65,000: Current trading level and psychological support
- $64,352: 54-day simple moving average providing intermediate support
- $60,000-$58,000: Potential target zone if bearish structure plays out
A sustained break above $67,523 would challenge Brandt's bearish setup, while failure to maintain support above $64,352 would increase pressure toward the $60,000 region and potentially toward $58,000.
Security Concerns: The Coldcard Incident Context 🔐
While not directly related to price action, the Coldcard wallet vulnerability that emerged during this period added uncertainty to the market environment. Coinkite confirmed seed generation weaknesses affecting certain firmware versions, prompting affected users to create new seeds and migrate Bitcoin holdings.
Onchain analysis suggested that approximately 1,596 BTC were stolen across three confirmed attack waves, with estimates suggesting a potential fourth wave could bring total losses to roughly 2,055 BTC. While unconfirmed, this security incident may have influenced some investor behavior, though no verified evidence directly links it to the strong ETF inflows observed during the same period.
What Investors Should Consider 🤔
Brandt's warning about a potential $58,000 retest reflects legitimate technical concerns, but it shouldn't be viewed in isolation. Several factors deserve consideration:
- Technical patterns provide probability frameworks, not certainties
- Institutional demand through ETFs represents genuine fundamental support
- Onchain metrics reveal both supply pressure and holder behavior
- Macroeconomic conditions increasingly influence crypto valuations
- Trend strength indicators suggest caution against assuming any single direction
Looking Ahead: The Path Forward 🚀
Bitcoin's near-term trajectory depends on whether it can reclaim and sustain movement above $67,260. A successful break would invalidate Brandt's immediate bearish setup and suggest momentum toward higher levels. Conversely, rejection at this level would keep consolidation intact and increase the probability of testing lower support zones.
The $58,000 level represents Brandt's technical scenario—a plausible outcome if bearish structure continues, but not a market forecast or guaranteed destination. The combination of weak trend strength, documented large holder selling, and technical resistance creates a scenario where caution remains warranted, even as institutional inflows provide offsetting support.
For market participants, the current environment rewards careful monitoring of both technical levels and institutional flows. Upcoming macroeconomic data, particularly inflation metrics and employment trends, will likely provide the catalyst for Bitcoin to break decisively from its current consolidation range. Until then, the battle between technical weakness and institutional strength will continue shaping price discovery in the world's largest cryptocurrency. 📈
You May Also Like

Market Analysis
XRP Price Falls 5% as Leverage Hits Seven-Month High
August 26, 2026

Market Analysis
Crypto Market Hits Extreme Greed: What This Means for Bitcoin
August 26, 2026

Market Analysis
Ethereum Price Rally Overheats Below $2,550 Resistance
August 26, 2026

Market Analysis
Hyperliquid Price Rally: HYPE Targets $97 Amid $80 Support
August 25, 2026