Category:
Market AnalysisXRP Price Bullish Pennant: Is $2 Within Reach?

XRP's Impressive Rally Sets Stage for Technical Breakout 🚀
Ripple's native token has captured significant market attention after delivering a remarkable 51% surge over just seven days. Trading near $1.48 on August 25, XRP climbed from approximately $1.00 to touch an intraday peak of $1.69 before profit-taking pressure emerged. This explosive move has left the cryptocurrency positioned at a critical technical juncture, with traders closely monitoring whether the momentum can sustain toward the psychologically significant $2 level.
The rally's foundation stems from renewed optimism surrounding US cryptocurrency regulation and improved macroeconomic conditions. President Donald Trump's engagement with industry leaders, including Ripple CEO Brad Garlinghouse, signaled potential progress on the CLARITY Act—legislation designed to clarify regulatory oversight between the Securities and Exchange Commission and the Commodity Futures Trading Commission. Simultaneously, Treasury Secretary Scott Bessent's announcement of increased long-dated Treasury buybacks helped reduce the 30-year US Treasury yield from 5.34% to approximately 5.19%, making risk assets like cryptocurrencies more attractive relative to government bonds.
The Bullish Pennant Formation 📊
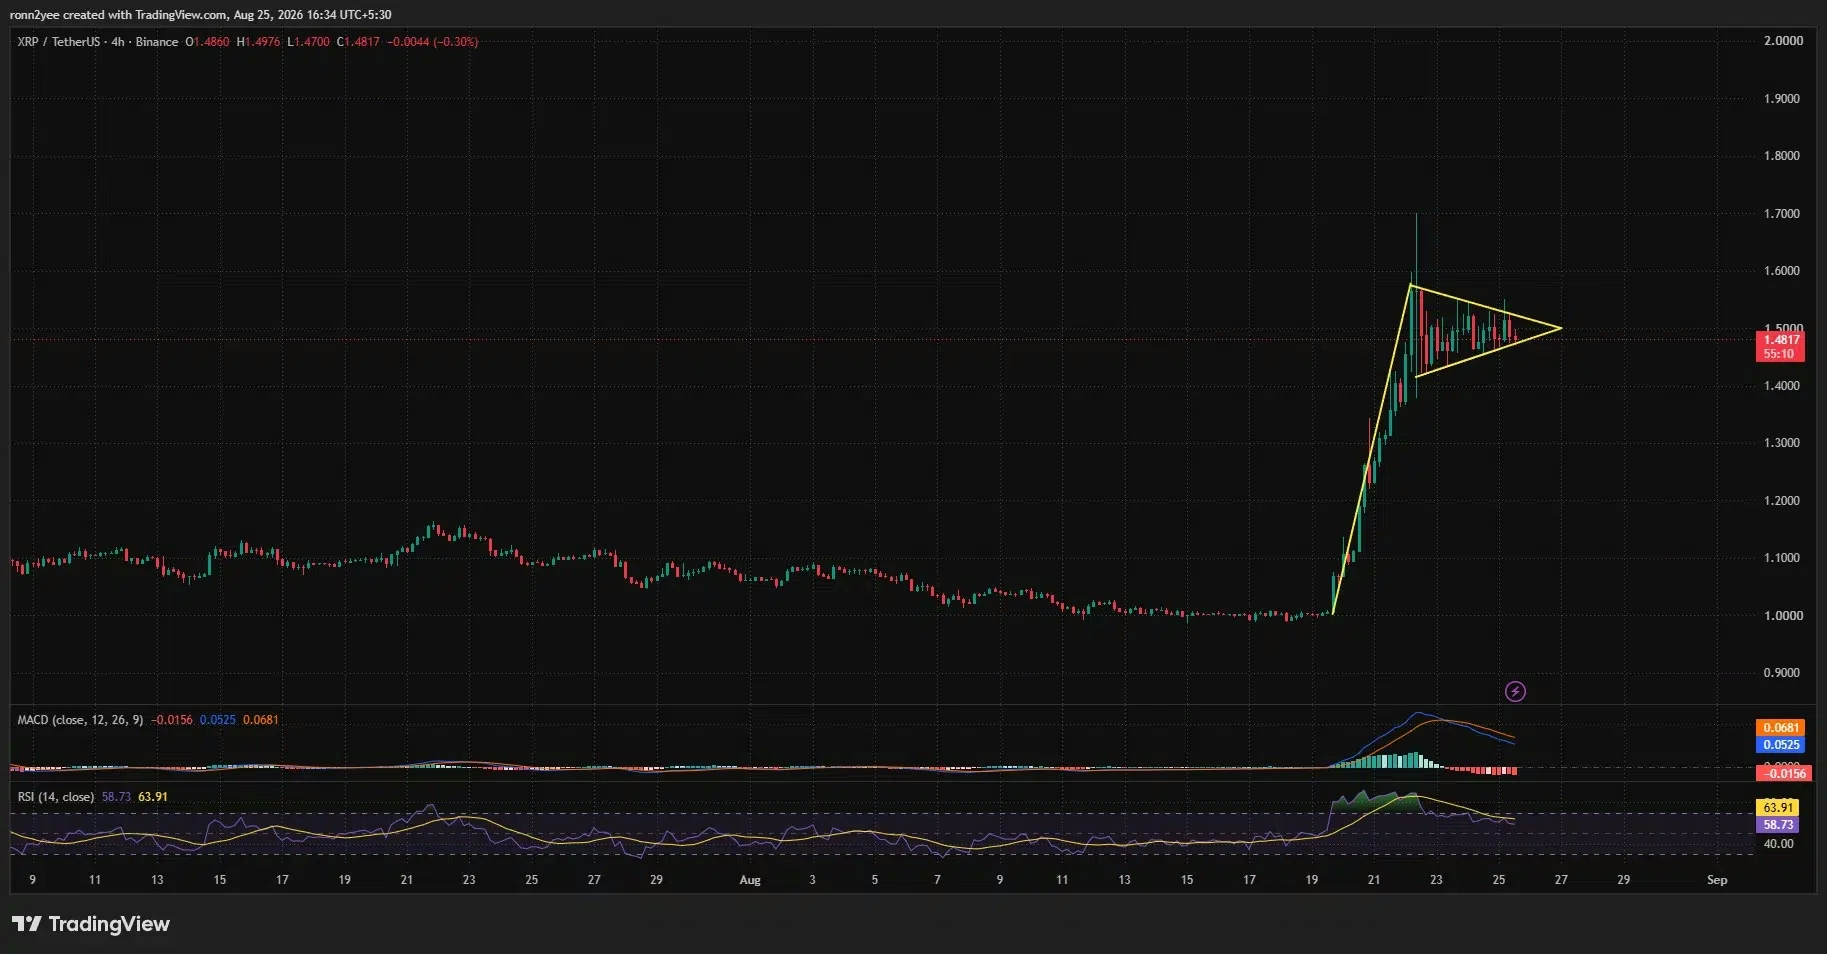
XRP's 4-hour chart reveals a textbook bullish pennant pattern that technical analysts view as a continuation signal. The formation consists of two distinct components: a steep flagpole that propelled the token from $1.00 to approximately $1.58, followed by a symmetrical consolidation phase marked by converging trendlines.
This pennant structure represents price compression between descending resistance and rising support levels. The strong upward movement preceding the consolidation gives the pattern its bullish character, distinguishing it from bearish pennant formations that follow downtrends. However, traders emphasize that the breakout remains unconfirmed—XRP must decisively close above the pennant's upper boundary with elevated trading volume to validate the continuation signal.
Measuring the Target 🎯
Traditional technical analysis employs a measured-move calculation to project potential price targets. By taking the flagpole's height (approximately $0.58 from the $1.00 base to $1.58) and adding it to the breakout point near $1.50, analysts derive a theoretical target slightly exceeding $2.00.
Notably, crypto analyst Altcoin Sherpa publicly endorsed this assessment, stating: "I think this consolidation is good and healthy though. $2 on this next move imo." While such measured moves provide directional guidance, they represent projections rather than guarantees, and multiple resistance levels stand between current prices and the $2 target.
Momentum Indicators Paint Mixed Picture ⚖️
XRP's technical indicators suggest momentum has cooled somewhat from its initial surge, though bullish conditions persist. The 4-hour relative strength index (RSI) retreated to 58.73 from overbought territory above 70, indicating that excess buying pressure has begun to normalize. A reading above 50 confirms that bullish momentum remains intact, though the pullback suggests healthy consolidation.
The moving average convergence divergence (MACD) indicator presents a more cautious signal. The MACD line has fallen below its signal line, with the histogram registering negative 0.0156, signaling weakened upward momentum during the pennant's formation phase. This bearish crossover warrants monitoring, though it's not uncommon during healthy consolidation periods.
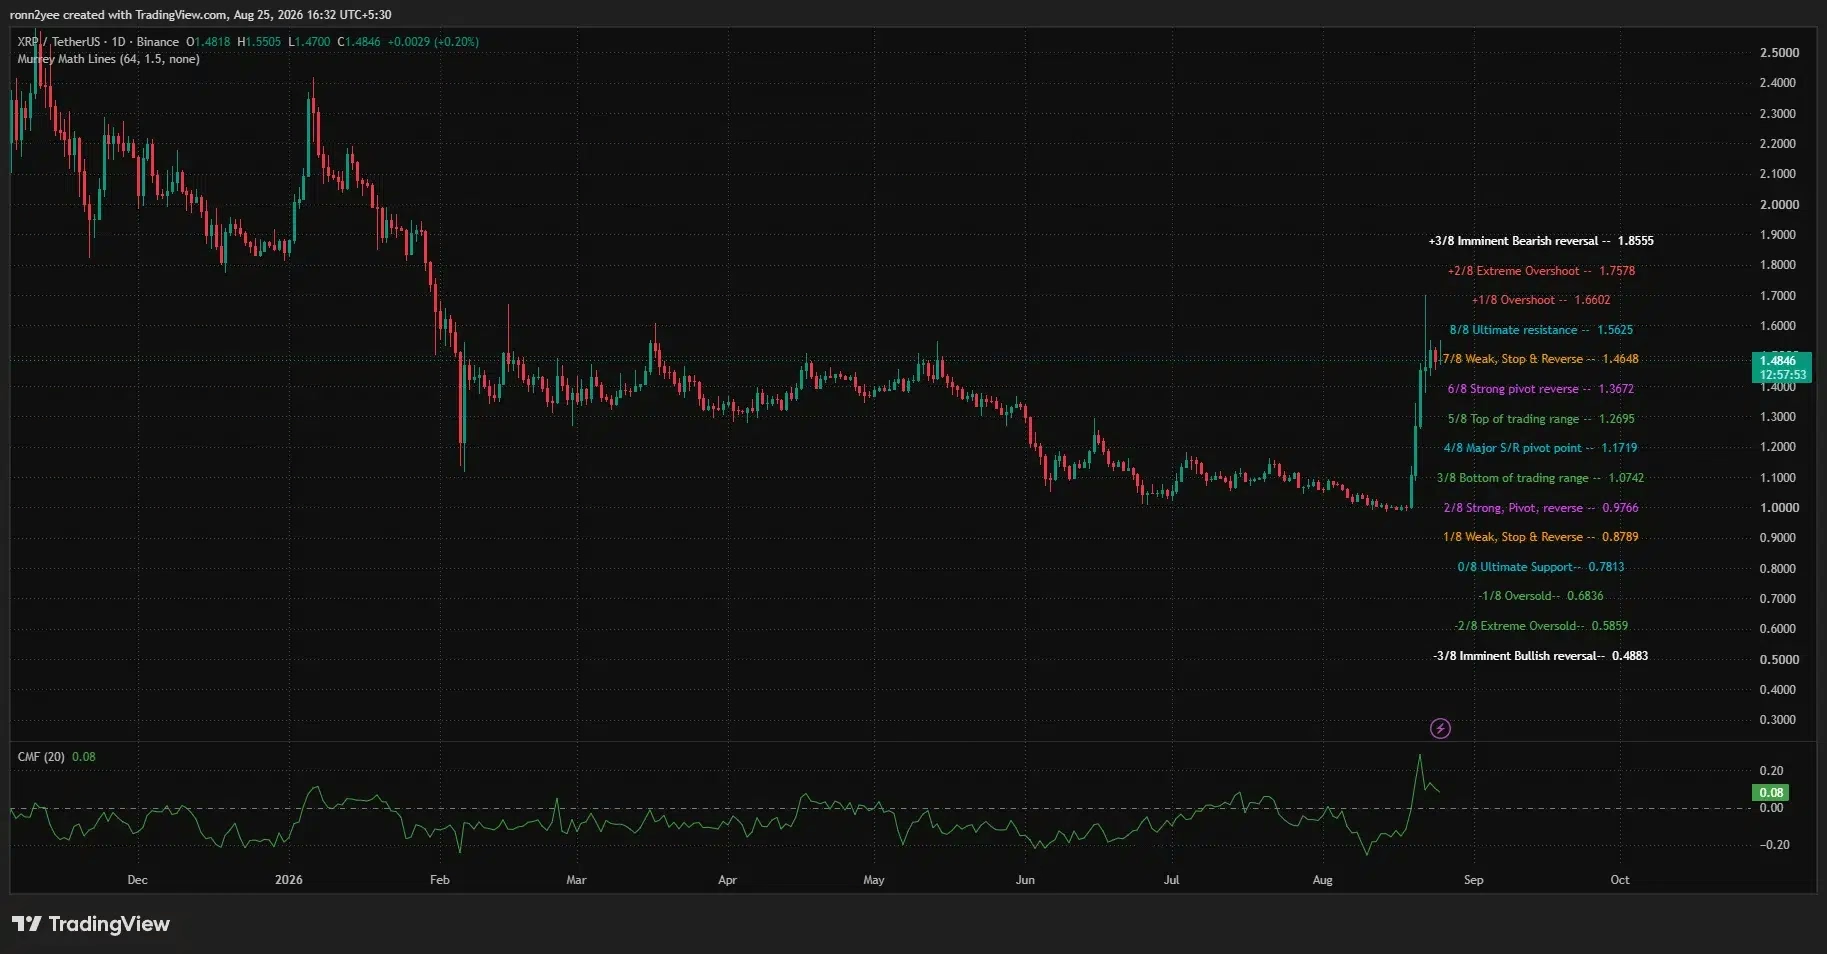
Chaikin Money Flow remains supportive, registering 0.08 and indicating that buying pressure continues to exceed selling pressure despite the pullback from the weekly high. A decline below zero would suggest capital outflows and potential weakening of bullish momentum.
Resistance Levels Define the Path Forward 📈
Multiple resistance zones stand between XRP's current consolidation and the $2 target. The immediate barrier sits at the Murrey Math level of $1.5625, which coincides with the pennant's upper boundary. A daily close above this threshold would represent a significant technical breakout and strengthen the bullish case.
Successive resistance levels emerge at:
- $1.6602 — near the weekly high
- $1.7578 — intermediate resistance
- $1.8555 — major structural level
- $2.00 — psychological target
XRP must methodically overcome each level, though the presence of significant liquidation clusters offers both opportunity and risk.
Liquidation Dynamics Influence Price Movement 💥
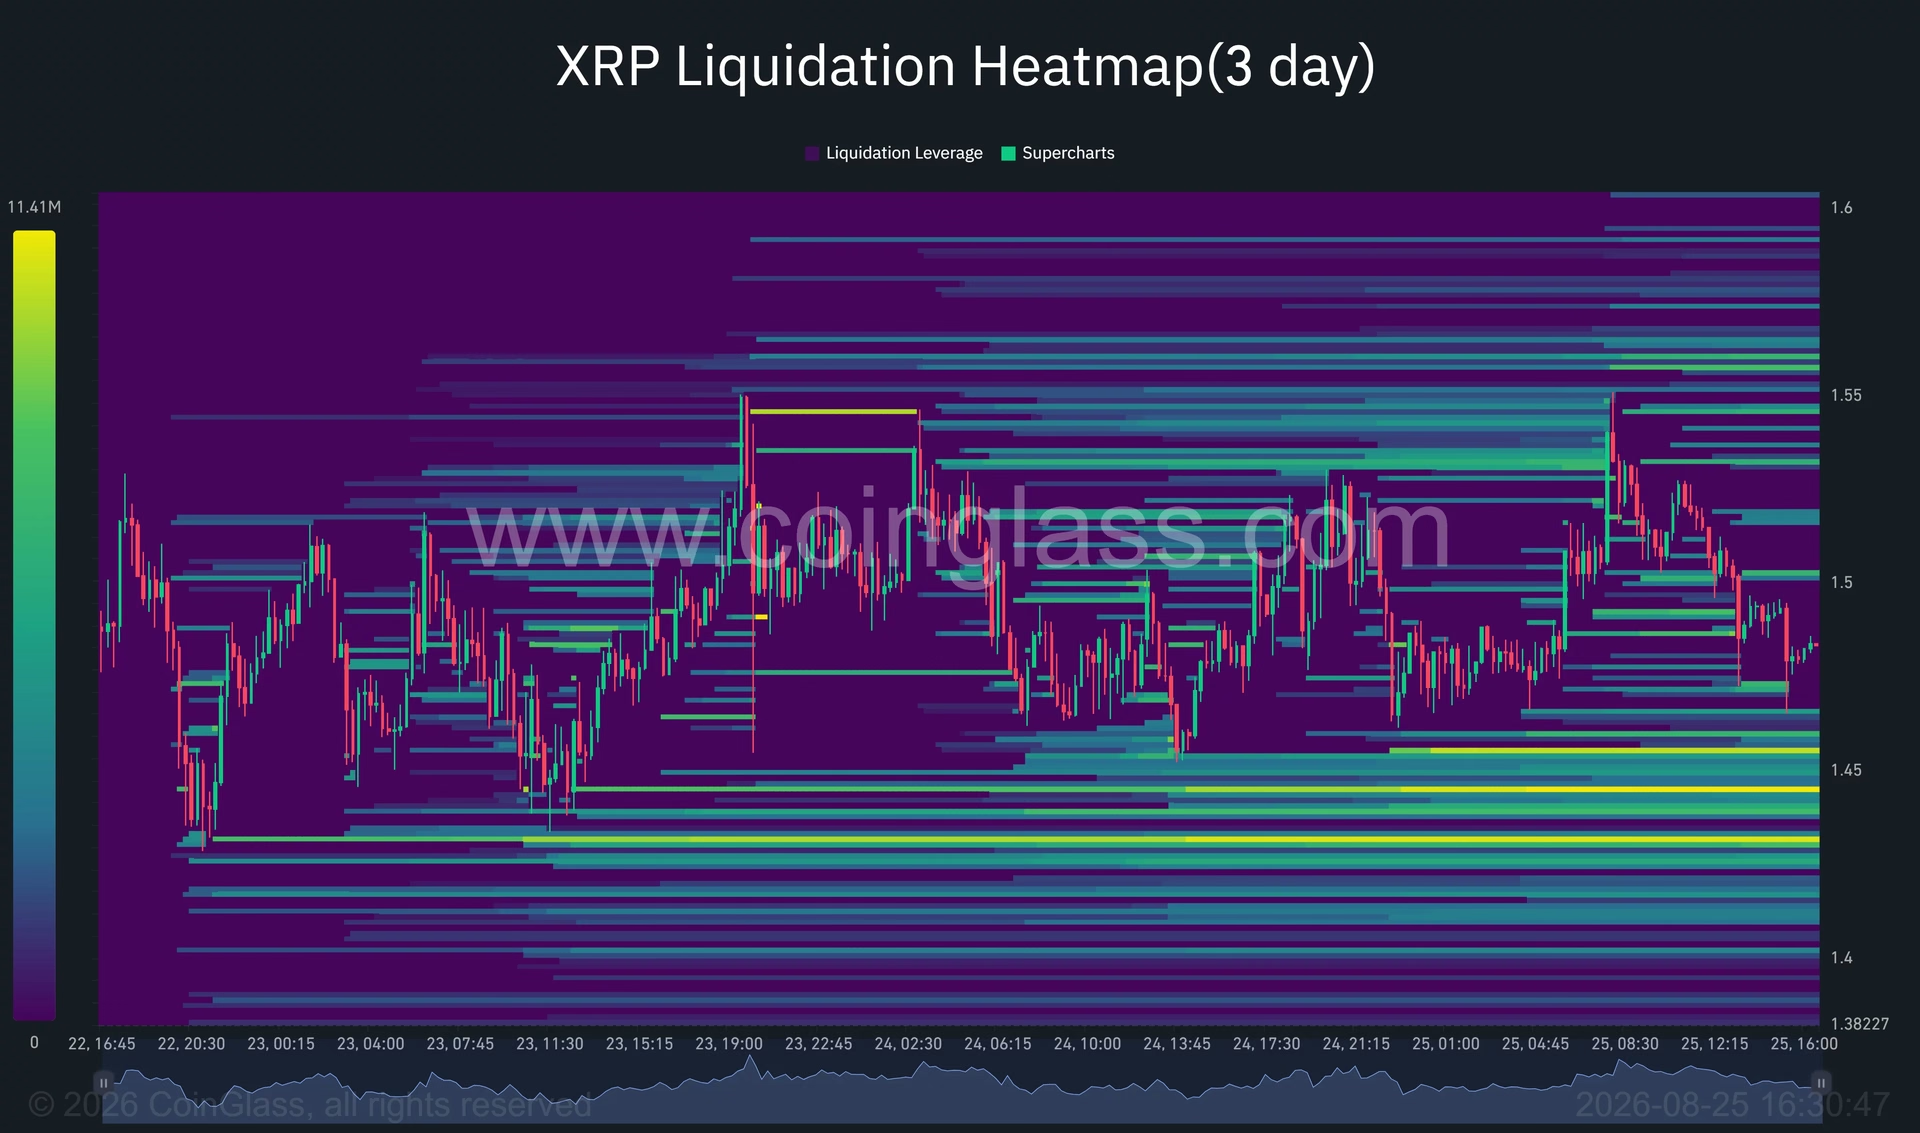
The three-day liquidation heatmap reveals critical information about leveraged positions that could accelerate or impede price movements. A notable concentration of liquidations exists between $1.54 and $1.56, precisely where technical resistance converges. When price approaches these zones, short liquidations can trigger cascading upside moves as automated positions close.
Downside liquidity clusters appear between $1.42 and $1.45, with another concentration near $1.43. A decline into these areas would liquidate leveraged long positions and potentially deepen pullbacks. The pennant's rising lower trendline provides initial support around $1.46, with major reversal support at $1.3672 and $1.2695 further below.
Fundamental Catalysts Supporting the Rally 🌟
Beyond technical patterns, several fundamental developments underpin XRP's recent strength. The token recorded approximately $18 million in daily inflows into US spot exchange-traded funds during the rally, providing direct institutional demand. This capital influx contrasts with periods of retail-only trading and suggests growing institutional interest.
Network activity metrics also indicate heightened engagement. According to Santiment data cited by analyst Ali Charts, XRP's active addresses surged 654.71%—from 47,180 to 356,070—demonstrating substantially increased network participation. While address activity doesn't indicate buying versus selling, rising participation typically accompanies market volatility and stronger conviction moves.
Whale wallet accumulation presents another bullish signal. Large holders reportedly accumulated an additional 380 million XRP during the week, suggesting sophisticated investors view current prices as attractive. If this accumulation pattern continues, it could reduce available supply and support price appreciation, though updated exchange-balance data would be needed to confirm sustained buying.
What Happens Next? 🔮
The immediate outcome depends on whether XRP can clear the $1.56 resistance level on strong volume. A confirmed breakout would validate the bullish pennant and activate the measured-move target near $2.00. Conversely, failure to break above $1.56 could trigger a retest of the $1.46 support level and potentially deeper pullbacks toward $1.42-$1.45.
Traders should monitor volume closely during any breakout attempt, as low-volume moves above resistance often fail to sustain. Additionally, watching the MACD for a bullish crossover would provide confirmation that momentum is re-accelerating rather than merely sustaining previous gains.
Key Takeaways 📌
XRP's technical setup presents compelling bullish characteristics, but success requires disciplined breakout confirmation. The token faces a critical juncture: breakthrough above $1.56 could unlock rapid advances toward $2.00, while failure would suggest consolidation or pullback phases. Institutional capital flows, regulatory optimism, and whale accumulation provide fundamental support, but technical resistance must be overcome to translate potential into realized gains.
The next 24-48 hours will likely prove decisive for determining whether this pennant evolves into a powerful continuation pattern or a false breakout that reverses into consolidation. Traders should maintain strict risk management and wait for clear confirmation signals before committing significant capital to directional positions.
You May Also Like

Market Analysis
XRP Price Falls 5% as Leverage Hits Seven-Month High
August 26, 2026

Market Analysis
Crypto Market Hits Extreme Greed: What This Means for Bitcoin
August 26, 2026

Market Analysis
Ethereum Price Rally Overheats Below $2,550 Resistance
August 26, 2026

Market Analysis
Hyperliquid Price Rally: HYPE Targets $97 Amid $80 Support
August 25, 2026