Category:
Market AnalysisXRP Price Falls Below $1 Amid Surging Whale Activity

The cryptocurrency market continues to present a complex puzzle for investors and analysts alike. 📉 Recently, XRP has found itself trading below the critical $1 psychological threshold, a development that has sparked considerable debate within the digital asset community. What makes this situation particularly intriguing is the simultaneous surge in whale activity—large transaction volumes have skyrocketed by 280% in just 24 hours, yet the price remains subdued. This disconnect between on-chain metrics and market performance raises important questions about what's really happening beneath the surface of XRP's current market dynamics.
Understanding XRP's Current Price Position 💰
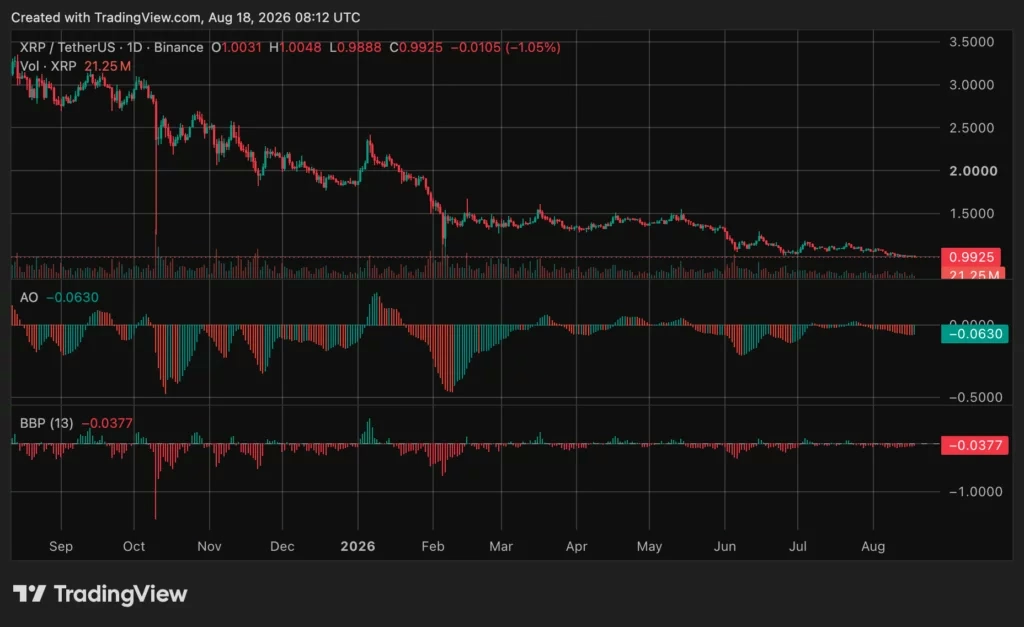
XRP recently traded near $0.996, marking a modest 0.4% decline over the previous 24 hours and a 1.2% weekly loss. The token's market capitalization hovers around $62.4 billion, maintaining its position as the sixth-largest cryptocurrency by market value. Over the past month, XRP has declined approximately 9.1%, while year-over-year comparisons reveal a more dramatic 66.7% drop from levels seen twelve months prior.
The price action has been characterized by narrow trading ranges, with the token oscillating between roughly $0.989 and $1.01 during recent trading sessions. The $1 level has emerged as both a critical technical barrier and a significant psychological threshold that bulls and bears continue to contest.
The Broader Downtrend Context 📊
To understand today's challenges, it's essential to examine XRP's trajectory from recent highs. The token peaked around $3.65 in July 2025, representing a dramatic reversal point. From that summit, XRP has entered a sustained downtrend characterized by lower highs and lower lows—a classic bearish pattern that technical analysts monitor closely.
This decline has compressed XRP into a consolidation zone centered near the $1 level. For much of the downtrend, this price point served as a floor, offering support to recovering buyers. However, the recent breakdown below $1 fundamentally changes the technical structure. Buyers now face a more challenging recovery path, as they must first reclaim $1 as resistance before attempting to challenge higher levels.
Deciphering the 280% Whale Activity Spike 🐋
One of the most talked-about developments is the reported 280% increase in large XRP Ledger transactions exceeding $1 million within a single 24-hour period. According to on-chain analysis, this pushed the count of such transactions above 38 instances. Naturally, this metric captured significant attention from market participants seeking signs of institutional or sophisticated investor accumulation.
However, interpreting whale activity requires nuance and careful analysis. Transaction volume alone doesn't definitively indicate whether large holders are buying, selling, or simply reorganizing their holdings. These transactions can encompass multiple scenarios:
- Exchange deposits — Moving tokens to trading platforms for potential sale
- Exchange withdrawals — Removing tokens to self-custody or other venues
- Internal transfers — Moving funds between personal wallets or addresses
- Custody reorganizations — Restructuring holdings for operational purposes
The critical insight is that the 280% spike in transaction volume didn't produce an immediate price recovery. In fact, XRP remained below $1 during this increased whale activity, suggesting that accumulation may not be the primary driver of these transfers. This disconnect between on-chain metrics and price action is a crucial red flag for bullish interpretations.
Exchange Flow Data Tells a Different Story 📈
Additional analysis from blockchain monitoring platforms reveals a more nuanced picture. Data indicates that whale transfers to Binance have fallen to their lowest levels since 2021, with the three-month average declining to approximately $61 million. Reduced exchange inflows theoretically decrease selling pressure, as fewer tokens are being deposited to trading platforms where they might be liquidated.
Yet this reduction hasn't triggered a sustained price recovery, suggesting that other factors are dominating market sentiment. Lower exchange deposits may simply reflect whales holding tokens in self-custody rather than necessarily indicating bullish accumulation.
Mixed Signals from Derivatives Markets ⚖️
The derivatives market presents another layer of complexity. Open interest on Binance increased by approximately 28.6% between August 3 and August 17, indicating that traders have been adding leveraged positions. This metric measures outstanding derivatives contracts but doesn't distinguish between long and short positions.
The combination of rising leverage alongside a weakening spot price creates a precarious situation. If XRP breaks decisively from its current trading range—in either direction—liquidations could cascade through the derivatives market, amplifying price movements. This dynamic adds volatility risk to an already uncertain environment.
Wallet Flow Analysis and Custody Trends 🔐
Data from major exchanges presents yet another puzzle. Coinbase recorded a net wallet count decline of 14,300 wallets on August 17, with more addresses withdrawing tokens than depositing them. Similar patterns emerged on Binance and Crypto.com, suggesting a broader trend of users moving XRP away from exchange platforms.
It's crucial to note that wallet counts measure the number of addresses, not the volume of tokens moved. A single large withdrawal can outweigh hundreds of smaller deposits in terms of actual token volume. Therefore, these metrics provide directional guidance rather than definitive evidence of accumulation or distribution.
Technical Indicators Remain Decidedly Bearish 📉
From a technical perspective, momentum indicators paint a cautious picture. The Awesome Oscillator registered approximately minus 0.0630 on the daily chart, confirming that bearish momentum remains active, though less extreme than during earlier stages of the decline. The Bull and Bear Power indicator similarly showed negative readings near minus 0.0377, reflecting limited buying pressure.
These indicators suggest that XRP hasn't yet reached a capitulation bottom. A genuine reversal would likely require the price to reclaim $1 and momentum indicators to move toward positive territory, signaling renewed buying conviction.
Key Resistance and Support Levels 🎯
For traders and investors monitoring XRP's technical structure, several price levels warrant attention:
Immediate Resistance: The $1 level remains the first hurdle for recovery. Clearing this psychological threshold is essential before bulls can challenge higher resistance.
Secondary Resistance: Between $1.05 and $1.16-$1.18, significant liquidity clusters exist. Reaching these areas would require stronger volume and sustained momentum.
Immediate Support: The $0.988 level, matching Tuesday's intraday low, represents the first support zone.
Extended Support: A daily close below $0.988 would expose $0.95, followed by a broader support zone between $0.85 and $0.90.
The Bridge Security Issue Context 🔗
Beyond price action and on-chain metrics, XRP's ecosystem has faced operational challenges. The tx bridge connecting the tx blockchain to the XRP Ledger experienced a significant security incident in early August, with attackers exploiting faulty deposit verification software to steal approximately 198,715.88 XRP from bridge reserves. This incident resulted in a halt to bridge operations, introducing additional uncertainty into the broader XRP ecosystem narrative.
Security incidents and operational disruptions can contribute to negative sentiment, even if they don't directly impact XRP's core functionality. Such events remind investors of the risks inherent in blockchain infrastructure and may influence trading decisions.
Separating Speculation from Reality 🔍
The cryptocurrency market generates considerable speculation around price targets and future movements. Some enthusiasts have suggested targets between $15 and $17, which would require gains exceeding 1,400% from current prices. Conversely, others predict declines into the $0.65 to $0.85 range. Both scenarios represent possible technical outcomes rather than confirmed destinations supported by current momentum readings.
Investors should approach such forecasts with healthy skepticism, focusing instead on what technical indicators and on-chain metrics actually reveal about current market conditions.
What the Data Actually Suggests 💡
When synthesizing all available information—whale activity, exchange flows, derivatives positioning, technical indicators, and price action—a coherent picture emerges:
- Large transaction volume increases don't necessarily indicate bullish accumulation
- Reduced exchange inflows suggest holders prefer self-custody but don't confirm buying demand
- Rising derivatives leverage combined with weak spot prices increases liquidation risk
- Technical indicators remain bearish, with no clear bottom-formation signals
- The $1 level remains psychologically significant but currently acts as resistance rather than support
Key Takeaways and Looking Ahead 🚀
XRP's current situation exemplifies the complexity of modern cryptocurrency markets, where multiple data sources often tell conflicting stories. The 280% spike in whale activity initially appeared bullish, yet the simultaneous price weakness below $1 suggests that large holders may be repositioning rather than accumulating.
For investors monitoring XRP, the critical question isn't whether whale activity is increasing—clearly it is. Rather, the important inquiry centers on what that activity represents and whether it will ultimately drive price recovery. Current technical indicators suggest patience may be warranted before confirming a sustained reversal.
The path forward depends on whether XRP can reclaim and hold above $1, supported by improving momentum indicators and sustained buying pressure. Until these conditions materialize, the current consolidation pattern and bearish technical setup suggest that caution remains appropriate. 📊
You May Also Like

Market Analysis
XRP Price Falls 5% as Leverage Hits Seven-Month High
August 26, 2026

Market Analysis
Crypto Market Hits Extreme Greed: What This Means for Bitcoin
August 26, 2026

Market Analysis
Ethereum Price Rally Overheats Below $2,550 Resistance
August 26, 2026

Market Analysis
Hyperliquid Price Rally: HYPE Targets $97 Amid $80 Support
August 25, 2026