Category:
Market AnalysisXRP Price Holds $1 as Whale Inflows Hit 2021 Low

🔍 The Current State of XRP: Stability Amid Uncertainty
Ripple's native token XRP has managed to maintain its footing near the critical $1.00 mark, yet the cryptocurrency landscape surrounding it tells a more complex story. Over the past seven days, XRP has experienced modest downward pressure, declining approximately 3.2% while trading volumes remain relatively subdued at around $900 million daily. With a market capitalization hovering near $62.8 billion, XRP continues to occupy a significant position in the digital asset ecosystem, but recent market dynamics raise important questions about whether this stability represents genuine strength or merely the calm before a potential storm. 📊
📉 Whale Inflows Plummet to Historic Lows
One of the most striking developments in the XRP market involves the dramatic reduction in large investor activity on major cryptocurrency exchanges. According to on-chain analysis from CryptoQuant contributors, the three-month average of substantial XRP transfers to Binance—one of the world's largest trading platforms—has collapsed to approximately $61 million. This figure represents a staggering decline from the $456 million recorded just months earlier in January, highlighting a shift in whale behavior that deserves serious attention.
The implications of reduced whale inflows carry significant weight for price action. When large investors deposit tokens onto exchanges, it typically signals preparation for potential sales, creating downward pressure on prices. Conversely, the current environment suggests that major holders are increasingly reluctant to move their holdings to trading platforms, which could indicate confidence in holding positions rather than liquidating them. However, this interpretation requires nuance, as the market must distinguish between reduced selling pressure and genuine buying demand. 💡
Historically speaking, such dramatic shifts in exchange inflows have preceded major market moves in both directions. The 2021 cryptocurrency bull run saw different patterns of whale behavior compared to today's environment, making direct historical comparisons challenging but still instructive for understanding potential future trajectories.
💰 Net Flows and Market Structure Analysis
While absolute inflows have declined dramatically, the directional flow of capital tells another important story. Net flows—the difference between deposits and withdrawals—remain positive at approximately $18.8 million, indicating that large investors are still depositing more tokens than they're removing. This nuanced picture suggests a market in transition rather than one showing clear bullish or bearish conviction.
The reduction in exchange activity aligns with broader cryptocurrency market trends, where overall trading volumes have contracted across multiple asset classes. This market-wide phenomenon reflects a period of consolidation following previous volatility, with both retail and institutional participants adopting a more cautious stance. The decline in whale inflows should therefore be contextualized within this larger market environment rather than viewed in isolation.
📈 Technical Analysis: Daily Chart Breakdown
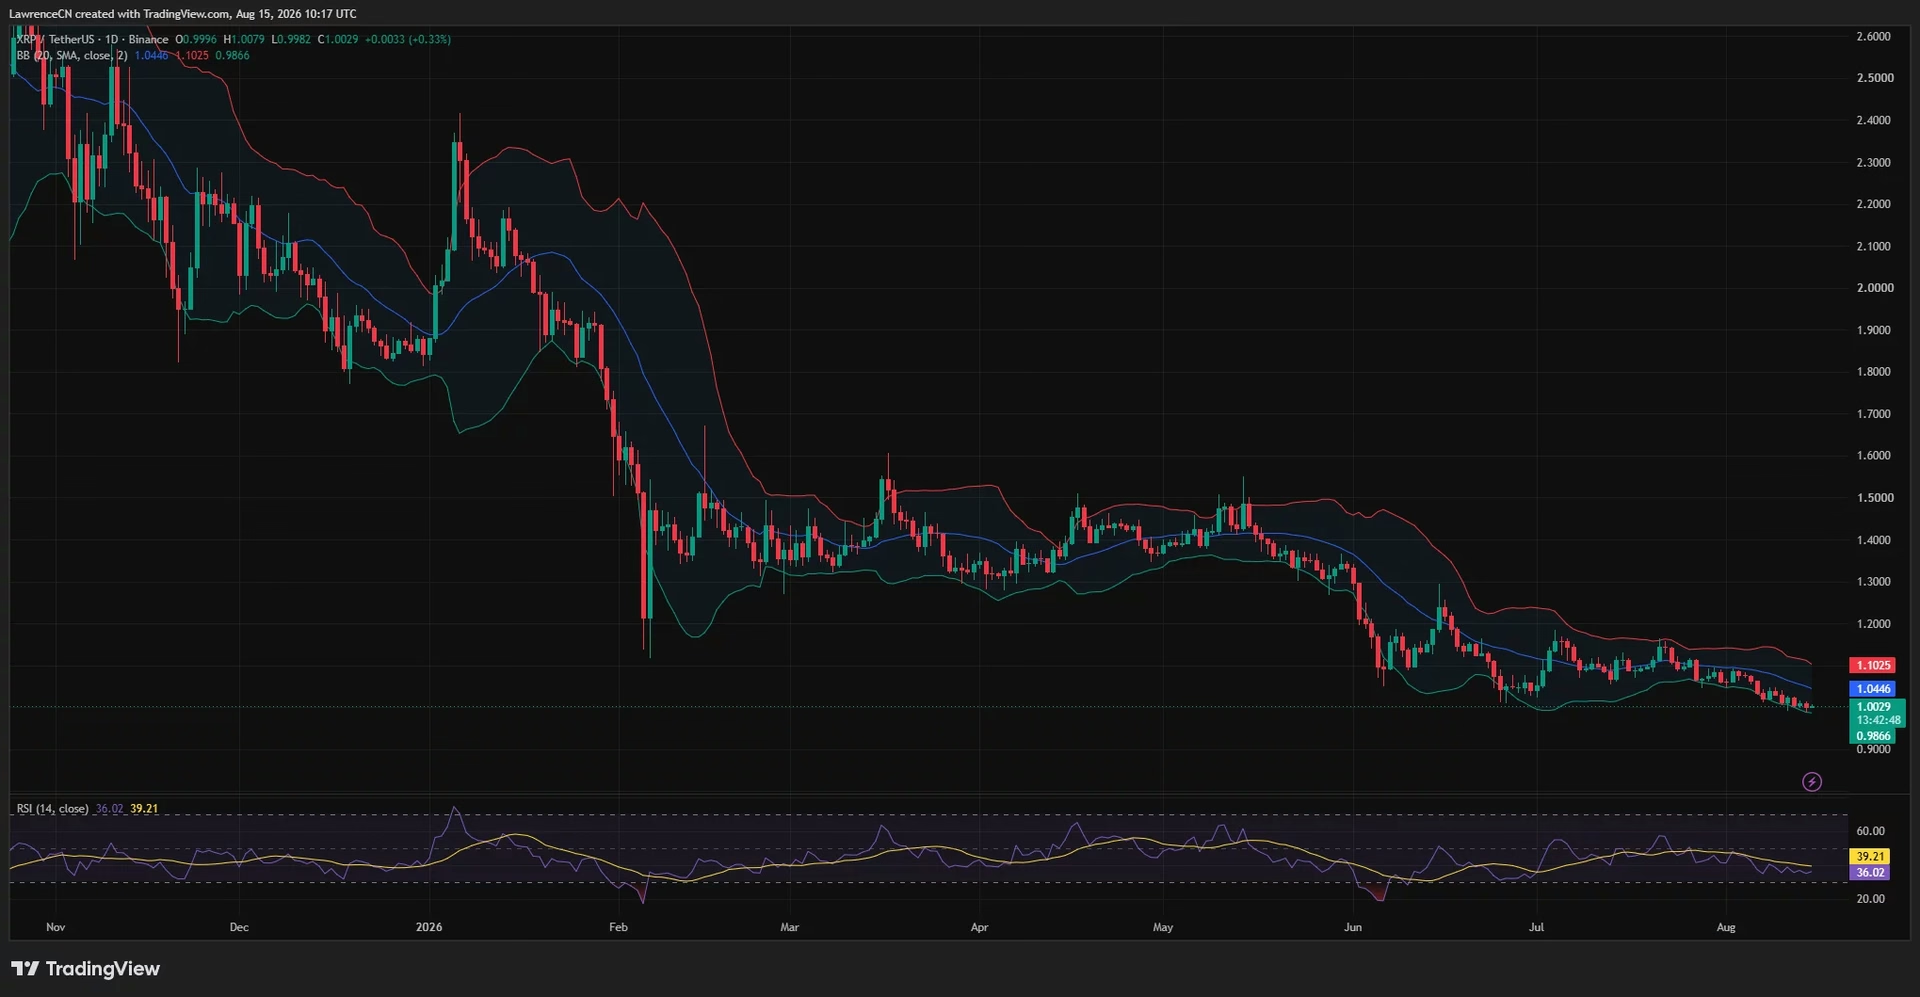
Examining XRP's daily technical structure reveals a market caught between competing forces. The token currently trades below the Bollinger Bands' 20-day middle line positioned at $1.0446, a configuration that keeps the short-term price structure tilted favorably toward sellers. However, the proximity to the lower Bollinger Band at $0.9866 creates an interesting dynamic—the compressed trading range between current prices and this support level increases the probability of a short-term bounce or corrective move.
The daily Relative Strength Index (RSI) reading of 36.02 demonstrates weak momentum without reaching oversold extremes. While below the conventional oversold threshold of 30 would typically signal an imminent reversal, the current reading of 36 leaves room for additional downside before reaching such extreme levels. This suggests that while selling pressure exists, the market hasn't yet reached the point where mean reversion becomes mathematically inevitable.
XRP has repeatedly oscillated around the $1.00 level since mid-August, with the most recent dip reaching $0.988 before buyer interest emerged. However, recovery attempts have consistently stalled near $1.01, suggesting that overhead resistance remains formidable. The absence of a clear daily reversal pattern—with lower highs and lower lows persisting since May's peaks—underscores the continuation of a downtrend that remains intact despite recent stabilization efforts.
🎯 Key Support and Resistance Levels
For XRP to establish a credible recovery, buyers must first reclaim the Bollinger middle line near $1.045. Breaking decisively above this level would represent a meaningful shift in daily structure and could attract fresh buying interest. The upper Bollinger Band at $1.1025 would then become the subsequent target if price closes above $1.045 with accompanying volume increases.
Downside scenarios present their own challenges. A close below the $0.9866 lower Bollinger Band would weaken the case for $1.00 as a sustainable support level and potentially expose the $0.95 zone. This layered support structure is crucial for understanding risk parameters in both bullish and bearish scenarios.
🔄 The Falling Wedge Pattern and 4-Hour Setup
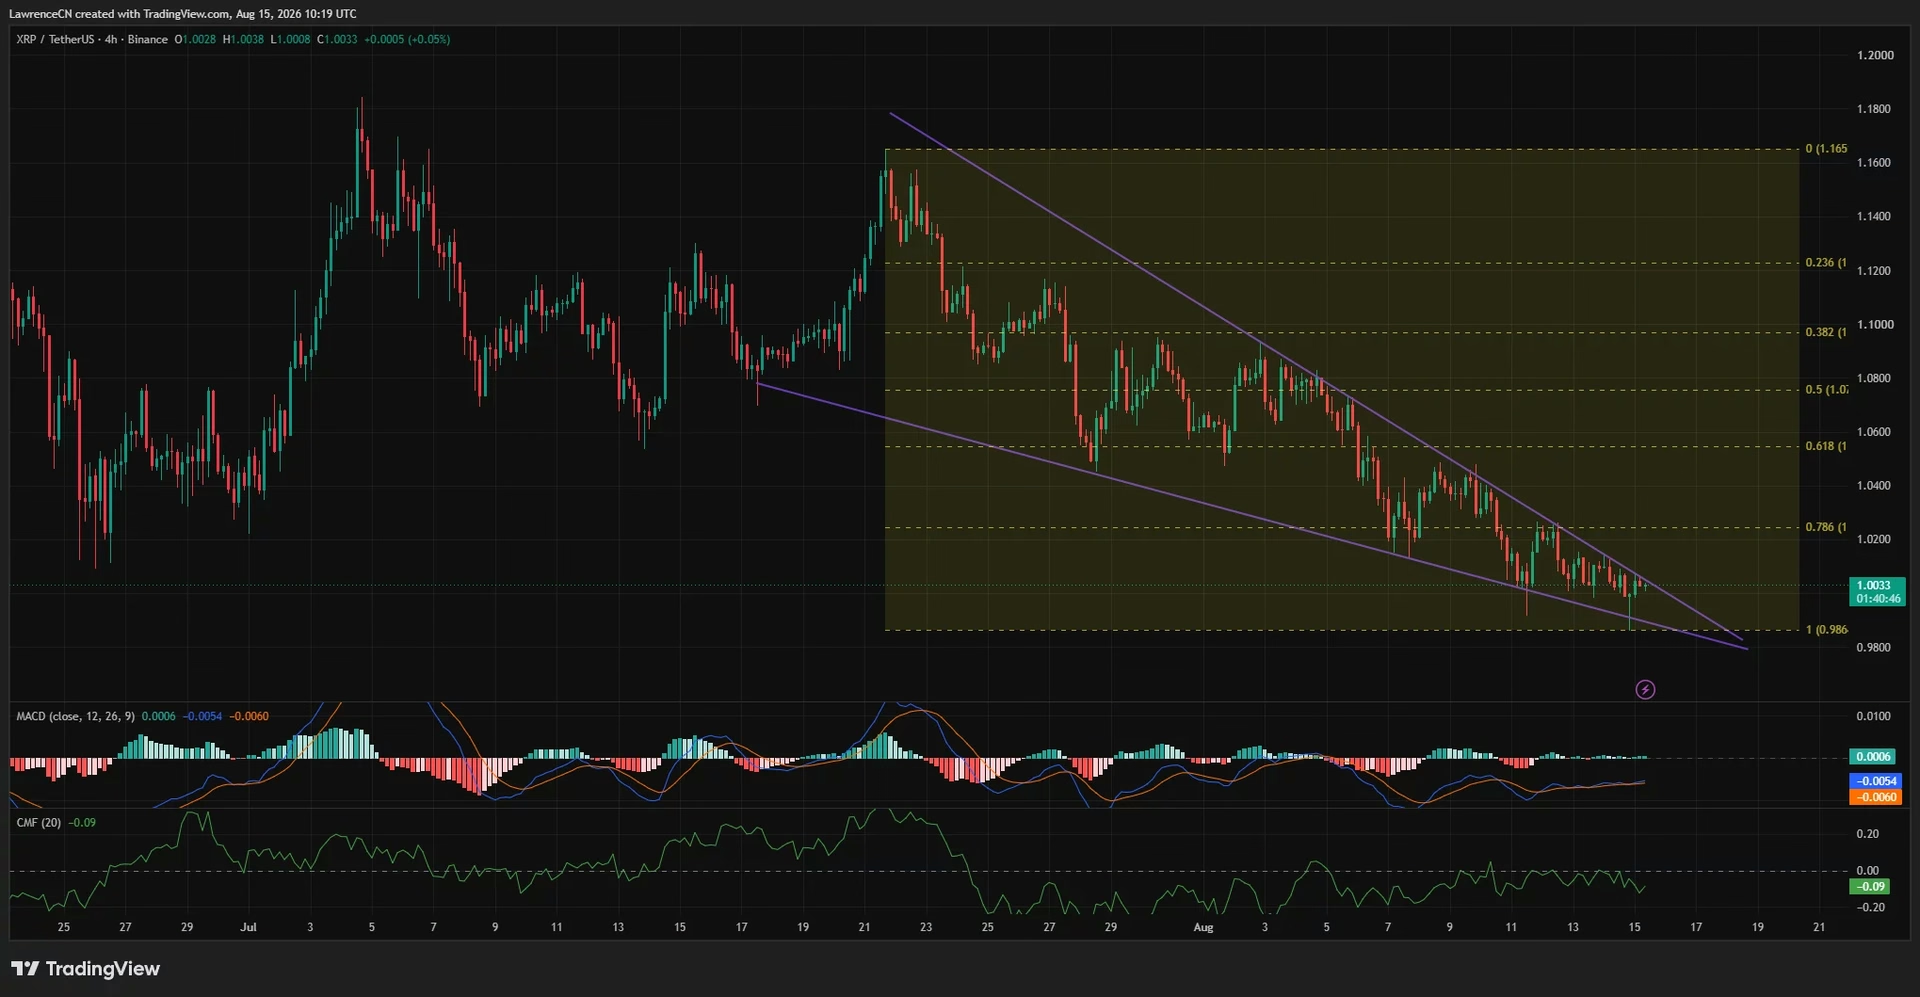
On the 4-hour timeframe, XRP has formed a falling wedge pattern following the July 21 high near $1.165. This technical formation has compressed significantly, with the two descending trendlines converging and creating an increasingly narrow trading range. Such configurations often precede breakout moves, as the available space for price movement contracts toward an inevitable resolution.
The first nearby resistance barrier sits at the 78.6% Fibonacci retracement level around $1.024. Breaking above this point and the wedge structure would open a path toward $1.055, followed by $1.076. Higher resistance appears near $1.097 and $1.123, creating a potential ladder of obstacles that XRP would need to navigate sequentially to challenge the July high near $1.165.
Momentum indicators on the 4-hour chart have begun showing early signs of improvement. The MACD line recently moved above its signal line, with the histogram turning slightly positive—a development suggesting that downside momentum may be easing. However, this technical improvement remains tentative, as both lines remain below zero, indicating that a confirmed trend change has not yet materialized. The Chaikin Money Flow indicator remains negative at minus 0.09, confirming that capital flows still favor sellers despite the technical improvements.
💥 Liquidation Dynamics and Price Targets
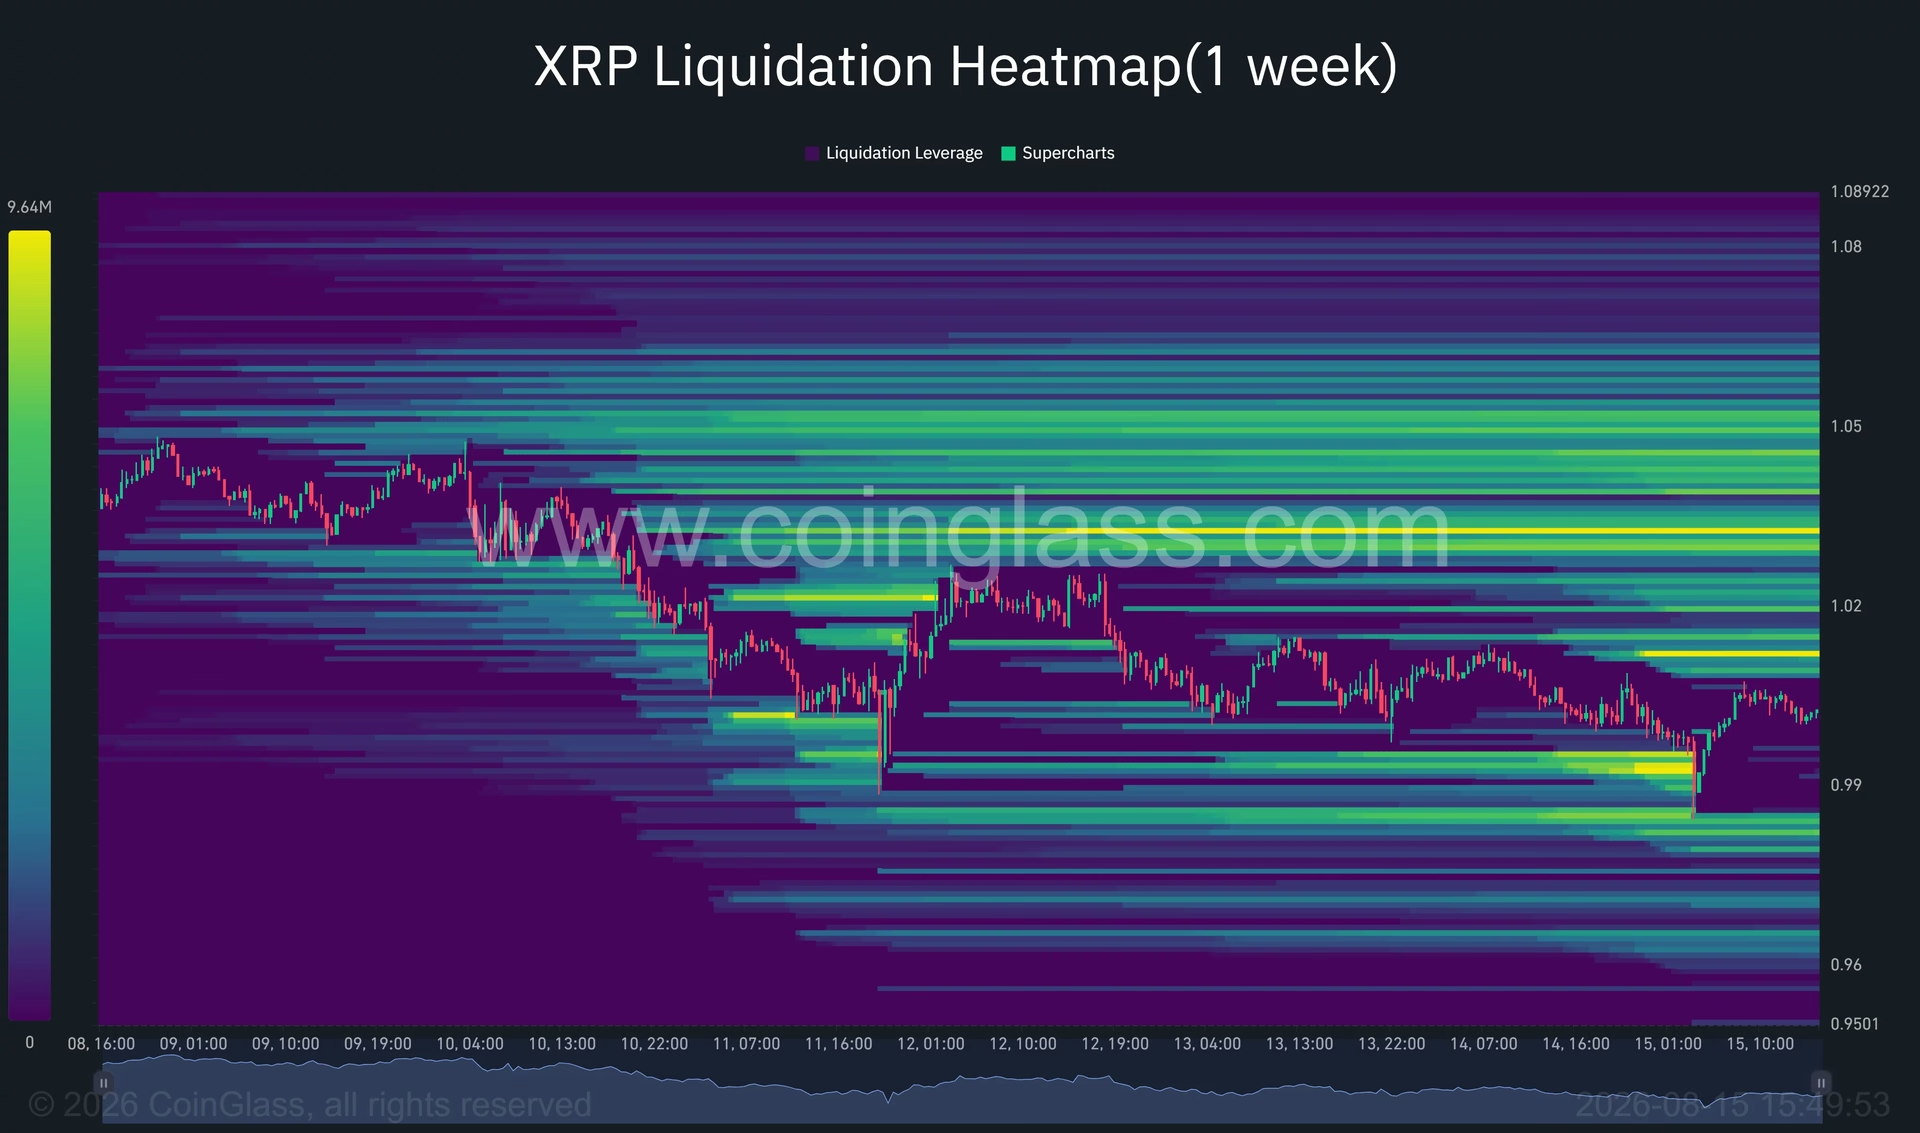
Analyzing one-week liquidation data provides crucial insights into where price might accelerate during potential rebounds. CoinGlass data reveals several concentrated clusters of leveraged positions above the current price level. The nearest liquidity concentration appears around $1.01, with larger pockets emerging between $1.02 and $1.03. The strongest overhead concentrations cluster near $1.03 and from approximately $1.045 to $1.05.
These liquidation zones carry significant importance because price often moves toward areas containing large leveraged positions. During a rebound scenario, reaching these levels would trigger cascading short liquidations, potentially accelerating upward momentum through a self-reinforcing mechanism. This dynamic explains why certain price levels act as magnets for price action—it's not merely technical resistance but rather the mathematical consequence of leveraged position distribution.
Downside liquidation support exists near $0.98 to $0.99, creating a safety net for price should XRP lose the $1.00 level. This layered liquidity structure across multiple price levels reflects the sophisticated nature of modern cryptocurrency markets, where leverage and liquidation cascades play crucial roles in price discovery.
⚠️ Weekend Liquidity Considerations
For traders operating during weekend hours, an important variable affects XRP's price behavior: reduced overall market liquidity. Thinner order books during these periods can amplify sudden price movements around key levels like $1.00. This liquidity dynamic means that weekend trading in XRP may exhibit more volatility and wider spreads than weekday trading, potentially creating both opportunities and risks for active traders.
🚀 What a Rebound Would Actually Require
The critical question facing XRP investors involves what conditions would need to materialize for a sustained recovery. Reduced whale inflows to exchanges represent only one piece of the puzzle—they eliminate one source of potential selling pressure but don't independently create buying demand. For a meaningful rebound to develop, the market would require fresh capital inflows from both retail and institutional participants.
A confirmed breakout above the $1.024 Fibonacci level would provide the first technical signal that XRP is genuinely breaking free from its month-long decline. Such a move, accompanied by volume increases and positive Chaikin Money Flow readings, would strengthen the case for higher prices. However, without these confirmatory indicators, even technical breakouts risk remaining corrective bounces rather than trend reversals.
🎬 The Broader Context: Ripple Ecosystem Developments
Beyond price action and technical analysis, understanding XRP's trajectory requires examining developments within the Ripple ecosystem itself. The XRP Ledger continues evolving with various upgrades and improvements, including recent initiatives gaining support from Ripple for bundled technical fixes. These fundamental developments, while less immediately impactful than price action, contribute to the long-term narrative surrounding XRP's utility and adoption prospects.
Regulatory clarity remains another crucial factor affecting XRP's trajectory. The cryptocurrency's history with regulatory challenges has created lingering uncertainty that periodically resurfaces in market sentiment. Any positive regulatory developments could catalyze renewed institutional interest, though such catalysts remain unpredictable.
📊 Comparative Market Conditions
XRP's current consolidation pattern reflects broader cryptocurrency market dynamics where Bitcoin and Ethereum similarly navigate uncertain terrain. The entire digital asset class has experienced reduced trading volumes and investor enthusiasm compared to earlier in the year, suggesting that XRP's challenges are not unique but rather part of a market-wide phenomenon.
Historically, such consolidation periods have preceded significant moves in either direction. The 2021 bull run saw similar patterns of reduced activity before explosive rallies, while bear markets have similarly featured periods of consolidation before further declines. This historical ambiguity underscores why technical and fundamental analysis must work in concert rather than in isolation.
🎯 Key Takeaways and What Lies Ahead
XRP's current position near $1.00 represents a critical juncture rather than a stable equilibrium. The dramatic reduction in whale inflows to exchange platforms suggests reduced immediate selling pressure, but this development alone cannot confirm a bullish reversal. Instead, it represents a necessary condition—the removal of one bearish headwind—rather than a sufficient condition for recovery.
The technical setup across multiple timeframes shows early signs of potential improvement, particularly the falling wedge formation on the 4-hour chart and MACD crossover signals. However, these developments remain tentative without confirmation from volume increases and positive money flow indicators.
For investors monitoring XRP, the immediate focus should remain on whether the token can reclaim the $1.045 Bollinger middle line with accompanying volume. Failure to do so would suggest that consolidation continues, while a decisive breakout above this level with strong volume would provide the first credible signal that a recovery is genuinely underway. Until such confirmation materializes, XRP remains caught between competing forces with the ultimate direction dependent on whether fresh buying demand emerges to overcome the lingering selling pressure that has characterized the recent downtrend. 🔮
You May Also Like

Market Analysis
XRP Price Falls 5% as Leverage Hits Seven-Month High
August 26, 2026

Market Analysis
Crypto Market Hits Extreme Greed: What This Means for Bitcoin
August 26, 2026

Market Analysis
Ethereum Price Rally Overheats Below $2,550 Resistance
August 26, 2026

Market Analysis
Hyperliquid Price Rally: HYPE Targets $97 Amid $80 Support
August 25, 2026