Category:
Market AnalysisXRP Price Rebounds to $1.10 as ETF Inflows Return

XRP's Recovery Signals Renewed Institutional Interest 🚀
The cryptocurrency market has witnessed a compelling turnaround for Ripple's native token, with XRP price climbing toward the psychologically significant $1.10 level as fresh capital flows back into exchange-traded funds. This rebound represents more than just a technical bounce—it reflects a broader shift in institutional sentiment and growing adoption of the XRP Ledger ecosystem.
On July 30, XRP demonstrated resilience by trading at $1.0917, representing a 1.68% daily gain and touching an intraday high of $1.0950. The movement came after the token had briefly dipped toward $1.045 earlier in the week, setting up what many traders view as a potential reversal pattern. However, beneath this surface recovery lies a more nuanced technical picture that warrants careful analysis.
The ETF Inflows Story: Institutional Capital Returns 💰
The catalyst for XRP's recent strength emerged from exchange-traded fund activity, which had stalled for several trading days before resuming. On July 29, XRP ETFs recorded $584,000 in net positive inflows, marking the first positive daily flow since July 25. While this figure may seem modest compared to XRP's $1.26 billion in reported spot trading volume, it carries significant symbolic weight for the broader market.
What makes this development particularly noteworthy is the consistency of weekly inflows. XRP ETFs have maintained net positive flows on a weekly basis for three consecutive weeks, suggesting that institutional investors view current price levels as attractive entry points. For US-based investors, these regulated investment vehicles provide a straightforward mechanism to gain XRP exposure without managing private keys or navigating decentralized exchanges.
The ETF resurgence arrives at a critical juncture for XRP's technical structure. The token has traded sideways since early July following its sharp decline from above $1.40 in May. This consolidation phase typically precedes significant directional moves, and the return of institutional capital could provide the catalyst needed to break through resistance levels.
Aviva Investors' Landmark Adoption: Institutional Validation 🏛️
Beyond ETF metrics, institutional confidence received a substantial boost from an unexpected quarter. Aviva Investors, a UK-based asset manager commanding approximately $350 billion in assets under management, announced plans to tokenize its USD Liquidity Fund on the XRP Ledger. This represents a watershed moment for blockchain adoption in traditional finance.
The significance cannot be overstated. Aviva's move transforms the XRP Ledger from primarily a payments and cryptocurrency trading network into a platform capable of serving institutional-grade financial products. By offering a tokenized share class to eligible investors holding crypto wallets, Aviva bridges the gap between traditional finance infrastructure and blockchain-based settlement systems.
This development also coincided with the XRP Ledger's implementation of the fixCleanup3_2_0 amendment on July 29, which addressed technical improvements to the network. The timing suggests coordinated efforts to enhance the ecosystem's functionality and appeal to sophisticated institutional users.
Technical Analysis: The $1.10 Resistance Zone ⚙️
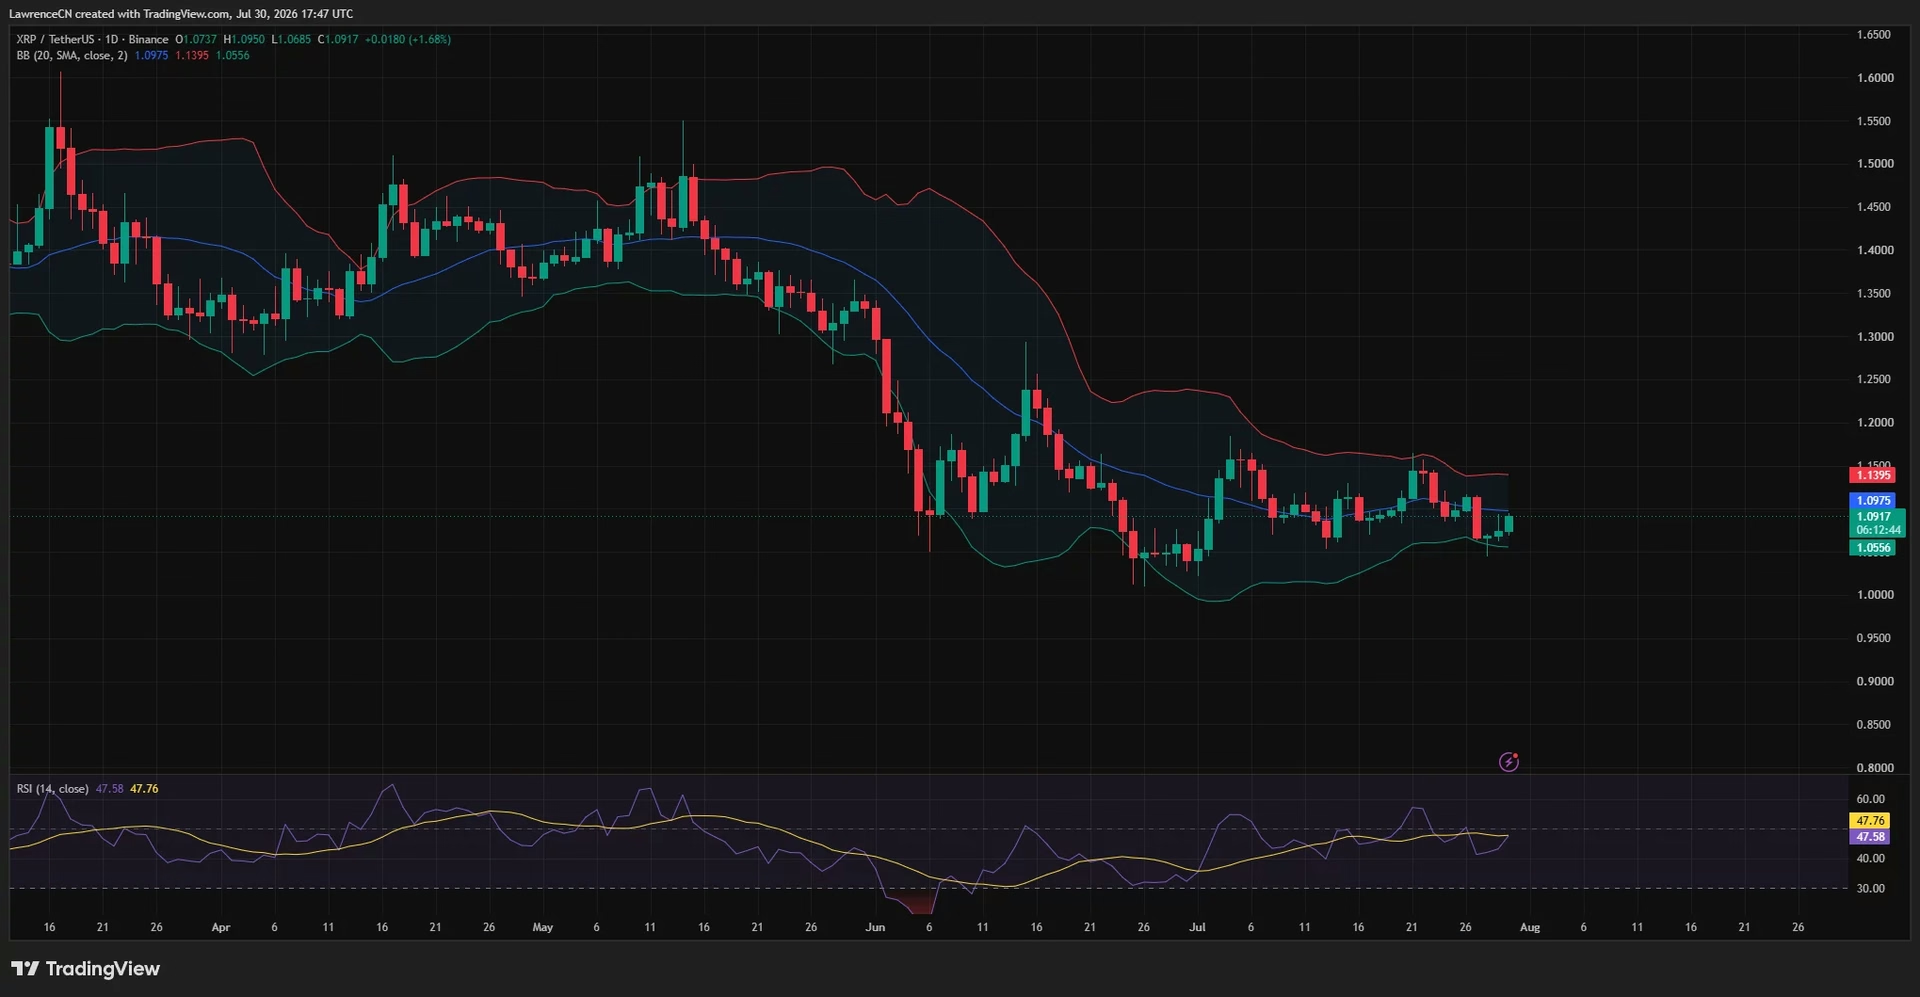
From a purely technical perspective, XRP's current price action presents a mixed picture that requires careful interpretation. The daily chart reveals that XRP has not yet confirmed a broader bullish reversal despite the recent recovery. The token trades slightly below the 20-day middle line of the Bollinger Bands at $1.0975, which now functions as immediate resistance.
A daily close above this level would represent a meaningful shift in momentum, potentially placing XRP back in the upper half of the Bollinger Band range. The next visible target would be the upper band at $1.1395, representing a potential 4.4% gain from current levels. However, achieving this requires sustained buying pressure that has not yet materialized convincingly.
The daily relative strength index (RSI) stands at 47.58, marginally below its signal line at 47.76 and comfortably under the neutral 50 reading. This indicates that while buying pressure has improved from late-June lows, bulls have not yet regained firm control. The RSI remains in neutral territory, suggesting neither overbought nor oversold conditions, but the slight bearish bias warrants caution among optimistic traders.
Four-Hour Chart Reveals Bearish Divergence ⚠️
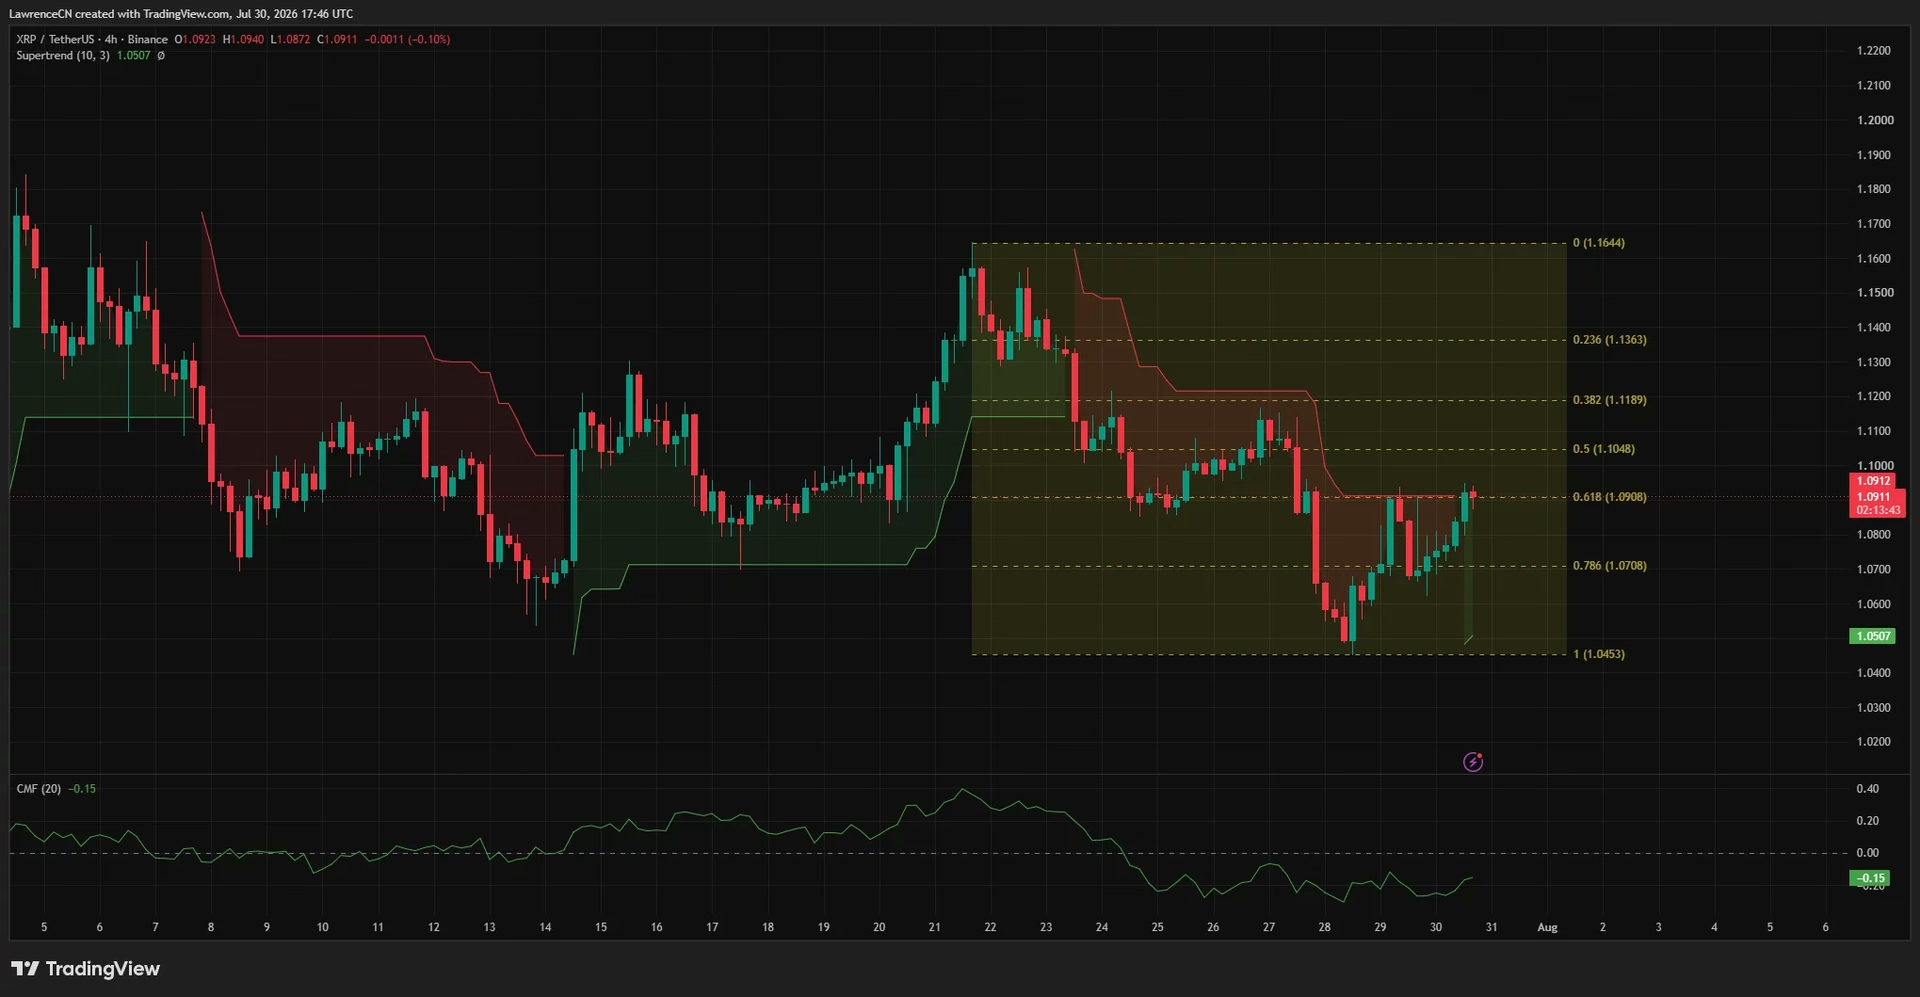
The four-hour timeframe presents a more concerning technical setup that contrasts with the price recovery. XRP trades directly against the 0.618 Fibonacci retracement level at $1.0908, calculated from the recent decline between $1.1644 and $1.0453. While the token briefly traded above this retracement level, it has not secured a convincing four-hour close beyond it.
More troublingly, the Supertrend indicator remains bearish on the four-hour chart, with its resistance line positioned near $1.0912. A confirmed break above this area would shift technical attention toward the 0.5 Fibonacci level at $1.1048, with higher targets at $1.1189, $1.1363, and the July swing high of $1.1644.
However, the most concerning element emerges from the Chaikin Money Flow (CMF) indicator, which stands at minus 0.15 on the four-hour chart. This negative reading indicates that capital continues to exit XRP positions despite the price recovery, creating a bearish divergence between rising prices and weakening underlying demand. This divergence typically precedes price corrections, as the selling pressure eventually overwhelms the buying enthusiasm.
Liquidation Heatmap: Where Markets May Move Next 🎯
Analyzing the liquidation landscape provides crucial insights into potential price targets and support levels. CoinGlass' three-day liquidation heatmap reveals a dense concentration of leveraged long positions immediately above XRP's current price, with the strongest nearby liquidity clustered around $1.098 to $1.10.
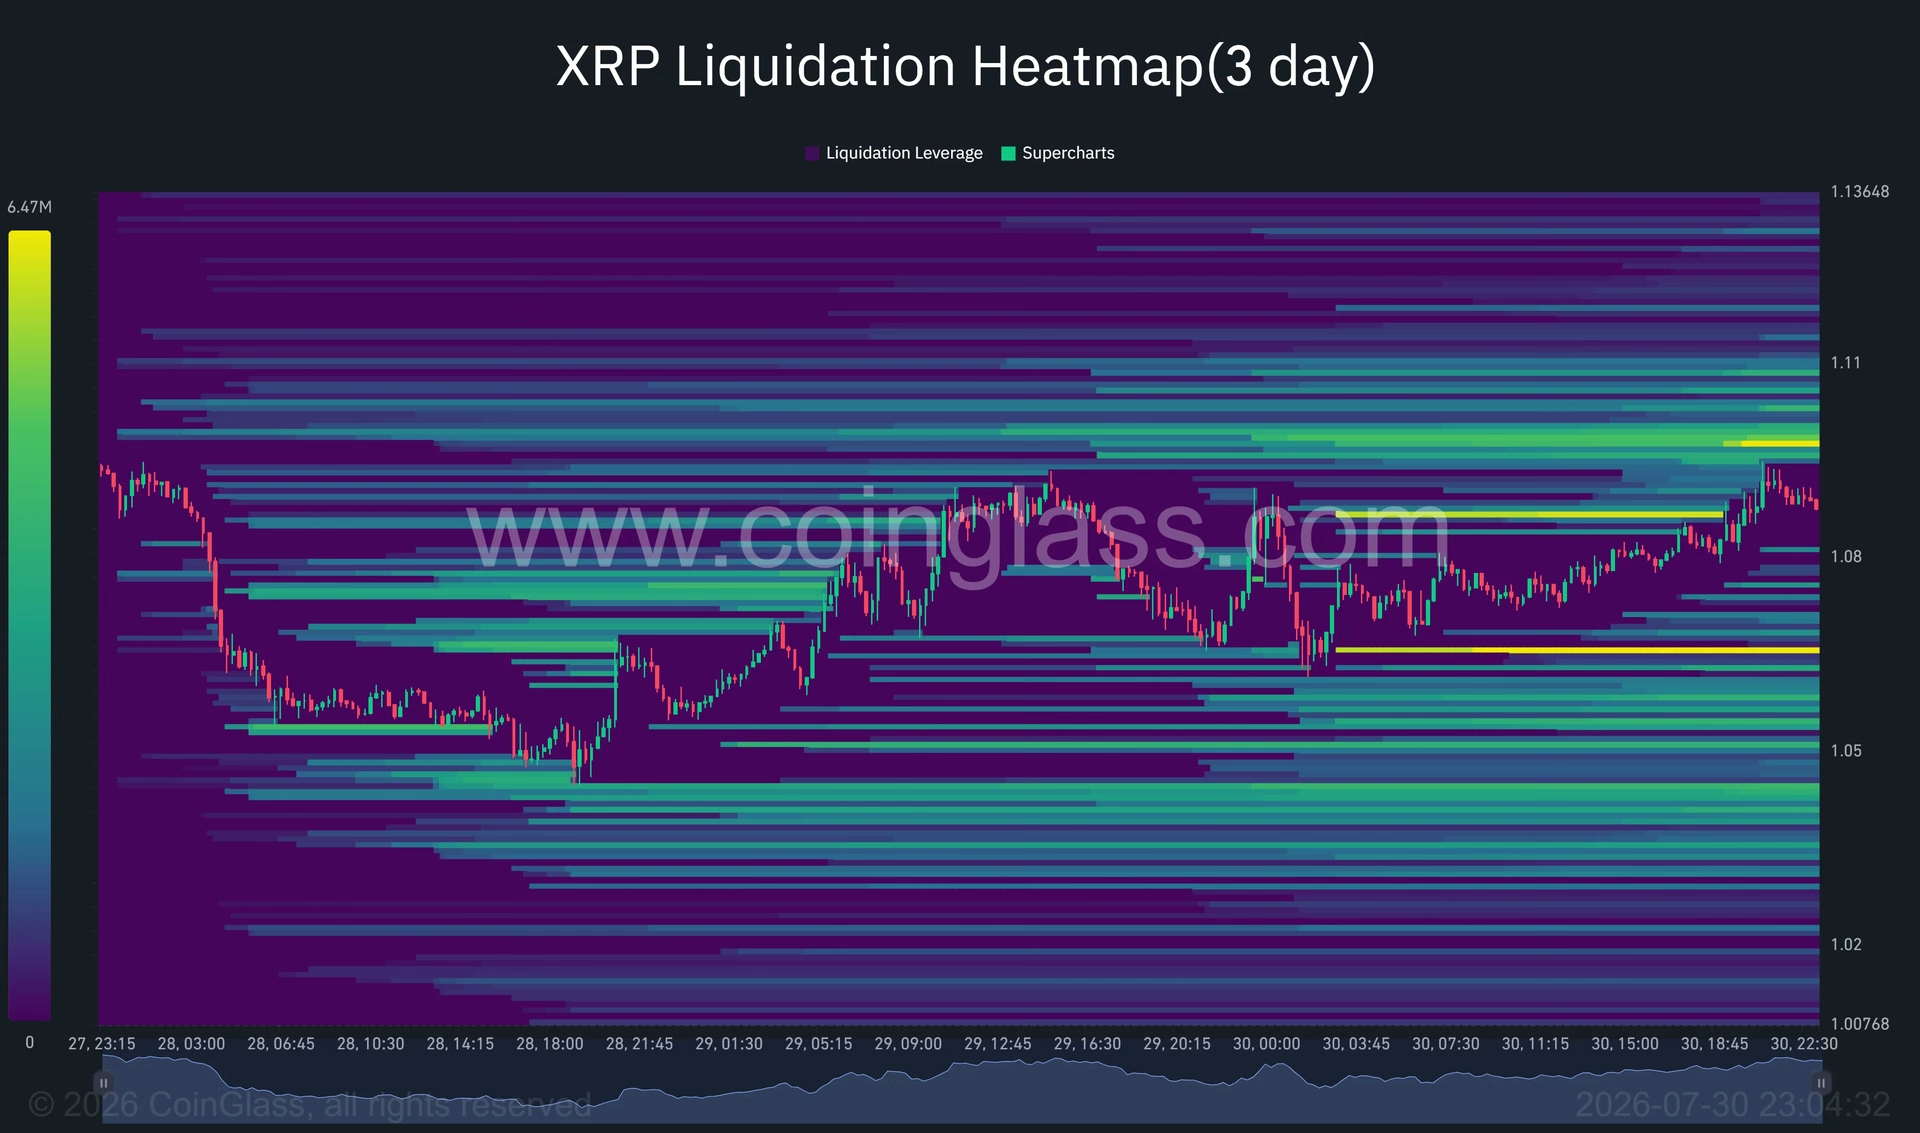
This liquidation concentration carries important implications for price action. Markets frequently gravitate toward large liquidation pools because forced position closures can accelerate momentum in either direction. A break through the $1.10 level could trigger short liquidations and generate additional upside momentum toward the next liquidity band near $1.11.
Conversely, a significant liquidation pool also exists just below $1.07, concentrated around $1.065. Should XRP face rejection near $1.10, this lower liquidity cluster could act as a magnet, drawing price back toward the $1.0708 Fibonacci support level. Further downside liquidity appears between $1.04 and $1.05, suggesting that a loss of the $1.065 support would expose the recent swing low at $1.0453 and potentially undermine the current recovery structure.
The Regulatory Uncertainty Factor 📋
While technical and fundamental developments provide reasons for cautious optimism, regulatory uncertainty continues to loom over XRP's medium-term prospects. The CLARITY Act, which aims to establish clearer regulatory frameworks for digital assets, remains stalled in legislative discussions. Further delays in regulatory clarity could keep compliance concerns in focus and potentially dampen institutional enthusiasm.
This regulatory headwind contrasts sharply with the positive signals from Aviva's adoption and ETF inflows. Institutions like Aviva likely conducted extensive legal and compliance reviews before committing to the XRP Ledger, suggesting confidence in the regulatory trajectory. However, any negative regulatory developments could quickly reverse these sentiment gains.
What Comes Next: Key Scenarios for XRP 🔮
XRP's immediate direction hinges on whether ETF-led demand and institutional adoption can overcome the bearish technical signals present on the four-hour chart. Several scenarios warrant consideration:
Bullish Scenario: A sustained daily close above $1.10 would strengthen the case for significant upside, with targets at $1.1189 and the upper Bollinger Band at $1.1395. This would require the Chaikin Money Flow to turn positive and the Supertrend to flip bullish on the four-hour chart.
Bearish Scenario: Rejection near $1.10 could return XRP to the $1.065–$1.071 support zone, with further downside potentially testing the recent low at $1.0453. This scenario becomes more likely if the negative money flow persists.
Consolidation Scenario: XRP could continue trading sideways in the $1.07–$1.10 range, allowing technical indicators to reset before the next directional move. This scenario aligns with the token's behavior since early July.
Institutional Adoption Reshaping XRP's Narrative 🌟
The convergence of ETF inflows and major institutional adoption represents a fundamental shift in how the market perceives XRP. Rather than viewing the token solely through the lens of payments infrastructure or regulatory challenges, sophisticated investors increasingly recognize it as a settlement layer for institutional financial products.
Aviva's tokenization initiative demonstrates that the XRP Ledger has evolved beyond its original use case. The ability to issue and settle tokenized financial instruments on the ledger opens possibilities for asset managers, custodians, and financial institutions worldwide. This expansion of use cases provides long-term fundamental support for XRP, independent of short-term price volatility.
Key Takeaways and What Investors Should Monitor 📊
The current XRP price action presents a nuanced picture that neither fully justifies bullish nor bearish conviction. Several critical factors warrant close monitoring:
- ETF flow consistency: Watch whether daily inflows continue or if the recent surge proves temporary
- Technical confirmation: A sustained close above $1.0975 on the daily chart would signal genuine momentum shift
- Money flow reversal: The Chaikin Money Flow must turn positive to support a sustained breakout
- Regulatory developments: Any CLARITY Act progress or adverse regulatory news could significantly impact sentiment
- Institutional adoption pace: Monitor whether other major financial institutions follow Aviva's lead
For traders, the $1.10 level represents a critical inflection point. A break above this resistance with positive money flow could spark a rally toward $1.1395, while rejection could return XRP to support levels around $1.065. Risk management remains paramount given the divergence between price strength and underlying demand indicators.
The XRP price recovery reflects genuine institutional interest and technological progress on the XRP Ledger. However, investors should remain cognizant of the technical warning signals embedded in the four-hour charts and negative money flow readings. The next few trading sessions will prove crucial in determining whether this rebound evolves into a sustained uptrend or represents merely a temporary relief bounce within a broader consolidation phase.
You May Also Like

Market Analysis
XRP Price Falls 5% as Leverage Hits Seven-Month High
August 26, 2026

Market Analysis
Crypto Market Hits Extreme Greed: What This Means for Bitcoin
August 26, 2026

Market Analysis
Ethereum Price Rally Overheats Below $2,550 Resistance
August 26, 2026

Market Analysis
Hyperliquid Price Rally: HYPE Targets $97 Amid $80 Support
August 25, 2026