Category:
Market AnalysisXRP Price Tests $1.06 as Open Interest Hits Six-Month Low

XRP Faces Mounting Pressure as Market Momentum Stalls 📉
The cryptocurrency market has been delivering mixed signals lately, and XRP is experiencing its share of headwinds. Trading near $1.07 in early August 2026, the token has struggled to gain meaningful traction despite several positive developments in the broader ecosystem. Buyers have found themselves locked in a battle to push XRP away from its lower trading range, with technical indicators suggesting limited conviction among market participants.
The current price action reveals a market in transition—neither decisively bullish nor catastrophically bearish. This equilibrium, while appearing stable on the surface, masks underlying weakness that traders and investors should understand before making positioning decisions.
Understanding the Six-Month Low in Open Interest 📊
One of the most telling indicators in XRP's current situation is the dramatic decline in open interest to levels not seen in six months. According to CryptoQuant data, XRP's open interest has compressed into a range between 362 million and 369 million—representing a significant contraction from earlier 2026 peaks. This metric matters because it reveals trader positioning and the amount of leveraged capital actively deployed in futures markets.
When open interest declines alongside falling prices, it typically signals that traders are closing positions rather than aggressively shorting the market. This phenomenon reduces the potential for cascading liquidations—the forced selling that can accelerate downward moves. However, this positioning reset also indicates a lack of aggressive buying interest, leaving XRP in a precarious middle ground.
The estimated leverage ratio has similarly declined toward 0.139 to 0.142, approaching the lowest readings observed during the same six-month period. This deleveraging process, while potentially reducing downside volatility, simultaneously removes the fuel needed for powerful recovery rallies.
The Liquidation Landscape: Balanced Rather Than Brutal 🔄
Market participants often assume that falling prices automatically trigger liquidation cascades. However, the current XRP environment tells a different story. CryptoQuant analysis reveals that funding rates have remained remarkably neutral, hovering between roughly negative 0.009 and positive 0.010 throughout the latest decline.
This near-zero funding environment is significant because it indicates balanced liquidations rather than one-sided capitulation. Long and short positions have been unwinding in relatively equal measure, suggesting that neither bulls nor bears have achieved decisive control. For traders accustomed to explosive moves, this equilibrium can feel frustratingly subdued.
Key observations about current market structure:
- Total derivatives open interest stands around $2.25 billion
- Futures volume has declined 10.27% over 24 hours
- Open interest fell 5.59% during the same period
- Funding rates remain close to neutral across major exchanges
- Long and short liquidations are occurring in alternating patterns
Technical Levels: The $1.05-$1.06 Battleground 🎯
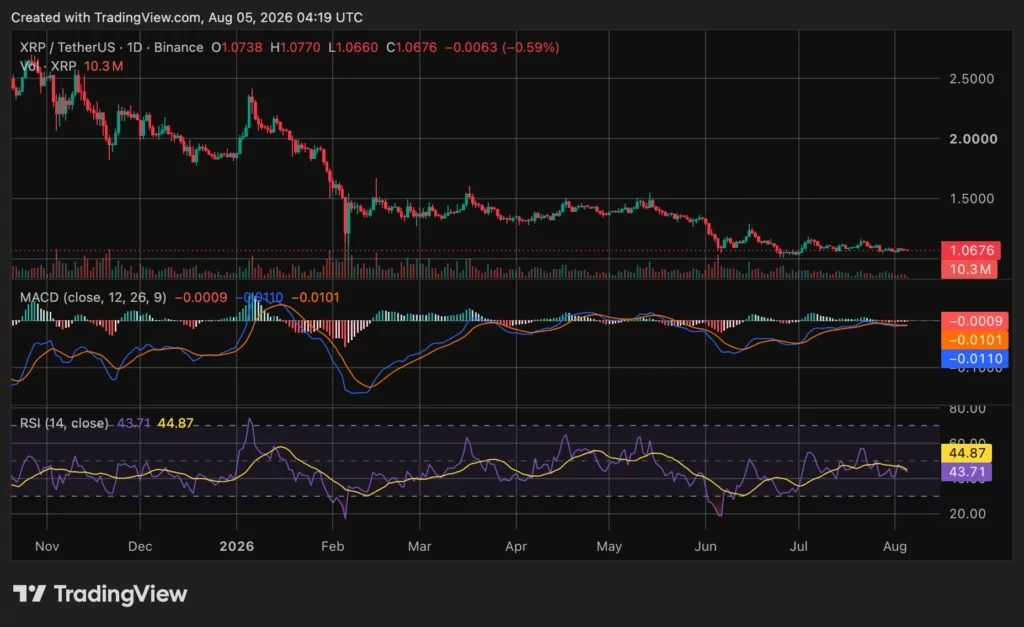
XRP has established a critical support zone between $1.05 and $1.06 that has repeatedly attracted buyers since late June. This area represents more than just a price level—it's a psychological and technical boundary where accumulated buying interest has consistently emerged. The token briefly broke below this support on July 28 before buyers stepped in to defend the level.
The daily relative strength index currently sits at 43.71, below the neutral 50 level and its moving average of 44.87. This reading confirms that buying momentum remains muted, though XRP has not yet entered deeply oversold territory that typically precedes sharp reversals. The MACD indicator reinforces this cautious outlook, with the MACD line near negative 0.0110 and the signal line around negative 0.0101, suggesting weak downside momentum rather than accelerating selling pressure.
Critical price levels traders are monitoring:
- Immediate support: $1.05-$1.06 (repeated buyer defense zone)
- Psychological floor: $1.00 (round number with late June lows at $1.01)
- First resistance: $1.10 (required for recovery confirmation)
- Secondary resistance: $1.13-$1.15 (has repeatedly capped advances since June)
A sustained break below $1.05 would expose the $1.00 psychological level, potentially triggering broader selling. Conversely, a daily close above $1.10 would provide the first meaningful evidence that buyers are regaining control, though further resistance at $1.13-$1.15 would still need to be overcome.
Institutional Demand Through U.S. ETFs: A Curious Disconnect 💼
One of the most intriguing aspects of XRP's current market structure is the apparent disconnect between institutional inflows and price performance. U.S. spot XRP exchange-traded funds have recorded four consecutive inflow days totaling approximately $15.4 million, yet the token remained pinned near $1.08 during that same period.
This phenomenon highlights a crucial market dynamic: institutional demand through regulated ETF vehicles has not proven sufficient to overcome selling pressure elsewhere in the market. Since the launch of five U.S. spot XRP funds between November and December 2025, these vehicles had attracted roughly $1.5 billion by mid-2026, creating a new regulated source of capital demand.
Despite this substantial institutional interest, XRP has remained confined to a narrow range around $1.00 to $1.13. This confinement suggests that while ETF inflows provide a steady bid, they lack the magnitude needed to propel the token significantly higher. The flows represent genuine demand, but they're competing against broader market uncertainty and potentially stronger selling from other market segments.
Network Valuation Versus On-Chain Activity 🔗
An often-overlooked metric in XRP analysis is the relationship between network valuation and actual transaction activity. Recent data reveals that network value to transactions ratio fell 42.7% compared with its three-month average, while transaction count declined only 23.3%. This divergence indicates that market valuation weakened faster than ledger usage.
While this metric doesn't provide a reliable timing signal for price reversals, it does suggest that market sentiment has deteriorated more sharply than fundamental network usage patterns. In other words, traders are valuing XRP more pessimistically despite relatively stable transaction activity on the network.
Spot Market Flows: Selling Pressure Moderating 📈
Spot market flows offer another window into retail and institutional demand dynamics. On August 5, the spot market recorded a net outflow of approximately $2.15 million. While this represents selling pressure, recent negative flow readings have been substantially smaller than the large outflow spikes recorded in late 2025.
This moderation suggests that selling intensity has diminished, though it hasn't reversed into sustained positive flows that would signal strengthening demand. The spot market remains in a precarious balance—neither attracting significant new capital nor experiencing panicked liquidations.
What Analysts Are Saying About XRP's Path Forward 🔮
Trading analysts have identified $1.06 as the deciding level for XRP's near-term direction. Bullish scenarios depend on the token holding support at this level and confirming a recovery structure. Upside estimates range from $1.35 to $1.64, though these targets remain conditional on specific price action confirmations.
Downside scenarios exist as well, with some analysts identifying $0.80 and potentially $0.62 as targets if support breaks decisively. However, neither bullish nor bearish path has been confirmed by current price structure and momentum indicators.
It's worth noting that highly speculative forecasts calling for "$23" or "$50+" circulate across social media platforms. These targets sit far above current price levels and lack support from verified institutional forecasts, established breakout structures, or current momentum indicators. Such predictions should be treated with considerable skepticism.
The Bottom Line: A Market Awaiting Direction ⚡
XRP's current market structure reflects a positioning reset rather than forced capitulation. The decline in leverage, neutral funding rates, and balanced liquidations all point to traders reducing risk rather than aggressively capitulating. This dynamic reduces immediate downside volatility but simultaneously removes the conviction needed for powerful recoveries.
The $1.05-$1.06 support zone will likely remain the battleground for weeks to come. Institutional ETF inflows provide a steady bid, but they haven't proven sufficient to overcome broader selling pressure. Until XRP establishes a clear recovery above $1.10 and eventually breaks through the $1.13-$1.15 resistance zone, the token will likely remain range-bound.
Key takeaways for XRP observers:
- Open interest at six-month lows reduces liquidation cascade risk but also limits recovery fuel
- Neutral funding and balanced liquidations suggest market indecision rather than capitulation
- U.S. spot ETF inflows provide institutional support but haven't translated into price momentum
- Technical levels at $1.05-$1.06 (support) and $1.10 (resistance) will be critical to watch
- Current structure favors patience over aggressive positioning in either direction
The coming weeks will be crucial in determining whether XRP can establish a sustainable recovery or whether the token will test lower support levels. For now, traders should focus on waiting for clearer directional signals rather than fighting against the current market ambiguity.
You May Also Like

Market Analysis
XRP Price Falls 5% as Leverage Hits Seven-Month High
August 26, 2026

Market Analysis
Crypto Market Hits Extreme Greed: What This Means for Bitcoin
August 26, 2026

Market Analysis
Ethereum Price Rally Overheats Below $2,550 Resistance
August 26, 2026

Market Analysis
Hyperliquid Price Rally: HYPE Targets $97 Amid $80 Support
August 25, 2026